How Contour Lines Reveal Drainage Problems on Your Property
Every drainage problem on a residential property has a story, and that story is written in contour lines. These seemingly simple curves on a topographic map encode the three-dimensional shape of your land into a two-dimensional format that, once you know how to read it, reveals exactly where water will flow, where it will collect, and where it will cause damage. Understanding contour lines drainage analysis is one of the most powerful skills a homeowner, contractor, or inspector can develop—because it transforms invisible terrain patterns into actionable intelligence.
At Low Point Labs, we specialize in decoding the topographic signatures of drainage problems. We've seen firsthand how a single closed contour ring around a backyard depression can explain years of mysterious basement flooding, and how a subtle convergence of contour lines can pinpoint the exact path stormwater takes to undermine a foundation. In this guide, we'll teach you how to read contour maps for drainage, recognize the telltale patterns that signal trouble, and use this knowledge to protect your property.
What Contour Lines Are and Why They Matter for Drainage
Contour lines are lines drawn on a map that connect points of equal elevation. If you imagine slicing a hill horizontally at regular intervals—say, every one foot—and then looking straight down at those slices, each slice would form a contour line. The vertical distance between successive contour lines is called the contour interval, and it's the key to understanding how steep or flat a given area is.
For drainage analysis, contour lines matter because water always flows perpendicular to contour lines, moving from higher elevations to lower elevations along the steepest available path. This is a fundamental law of hydrology, and it means that a contour map is essentially a blueprint of water movement across your property. If you can read contour lines, you can predict where every raindrop that falls on your lot will travel.
The relationship between contour line spacing and slope is straightforward: closely spaced contour lines indicate steep terrain, while widely spaced contour lines indicate gentle or nearly flat terrain. For residential drainage, both extremes can create problems. Steep slopes can cause erosion and rapid runoff that overwhelms downstream areas, while flat areas may lack the gradient needed to move water away from structures. The sweet spot for residential grading is typically a minimum 2% slope (approximately a 2.5-inch drop over 10 feet) away from the foundation for at least the first 6 to 10 feet—and contour lines will tell you immediately whether your property meets this standard.
Modern elevation data, such as that available through the USGS 3D Elevation Program (3DEP), has made high-resolution contour mapping accessible for residential properties. LiDAR-derived elevation models can produce contour maps with sub-foot intervals, revealing micro-topographic features that traditional survey methods might miss. This level of detail is transformative for drainage analysis because residential drainage problems often involve elevation differences measured in inches, not feet.
Get Your Drainage Intelligence Report™
Start a free trial and generate reports on demand.
The Fundamentals of Reading Contour Maps for Drainage
Before you can identify drainage problems on a contour map, you need to master a few fundamental principles of reading contour maps drainage patterns. These rules are universal—they apply whether you're looking at a USGS quad sheet covering square miles or a site-specific survey of a quarter-acre lot.
Water Flow Direction
Water flows perpendicular to contour lines, from higher contour values to lower contour values. To determine flow direction at any point on a map, imagine placing a ball on the terrain surface at that point—the direction it would roll is the direction water will flow. On a contour map, this direction is always at a right angle to the nearest contour line, pointing toward the next lower contour line.
This principle allows you to trace the path water will take across your entire property. Start at any point along your roofline or property boundary, draw a line perpendicular to the nearest contour, continue that line until it crosses the next contour, adjust direction to remain perpendicular, and repeat. The resulting path is the flow line or flow path for water originating at that point.
Slope Calculation from Contour Spacing
Slope is calculated by dividing the elevation change (rise) by the horizontal distance (run). On a contour map, the rise between adjacent contour lines is always equal to the contour interval, and the run is the map distance between those lines. If your contour interval is 1 foot and two adjacent contour lines are 20 feet apart on the map, the slope is 1/20 = 5%. If those same contour lines are 50 feet apart, the slope drops to 1/50 = 2%.
For residential drainage, critical slope thresholds include:
- Less than 1% slope: Water will pond and stagnate. Drainage is functionally absent.
- 1–2% slope: Marginal drainage. Water moves slowly and may not clear before the next rain event.
- 2–5% slope: Ideal range for most residential grading near foundations.
- 5–10% slope: Good drainage but may require erosion control measures.
- Greater than 10% slope: Erosion risk increases significantly; terracing or retaining walls may be needed.
Contour Line Shapes and Their Meaning
The shape of contour lines encodes the shape of the terrain:
- Concentric closed loops: Indicate a hilltop (decreasing elevation inward) or a depression (increasing elevation inward). Depressions are typically marked with hachure marks—short lines pointing inward toward the low point.
- V-shapes pointing uphill (toward higher elevation): Indicate a valley or drainage channel. Water flows down the axis of the V.
- V-shapes pointing downhill (toward lower elevation): Indicate a ridge or spur. Water flows away from the axis of the V on both sides.
- Parallel, evenly spaced lines: Indicate a uniform slope—a planar surface tilted at a consistent angle.
- Irregular, unevenly spaced lines: Indicate complex terrain with variable slopes and potential drainage complications.
Topographic Drainage Patterns That Signal Problems
With the fundamentals in place, let's examine the specific topographic drainage patterns that reveal drainage problems on residential properties. These patterns are the visual signatures of trouble, and learning to recognize them is the core skill of contour-based drainage analysis.
Closed Contour Depressions (Bowls and Basins)
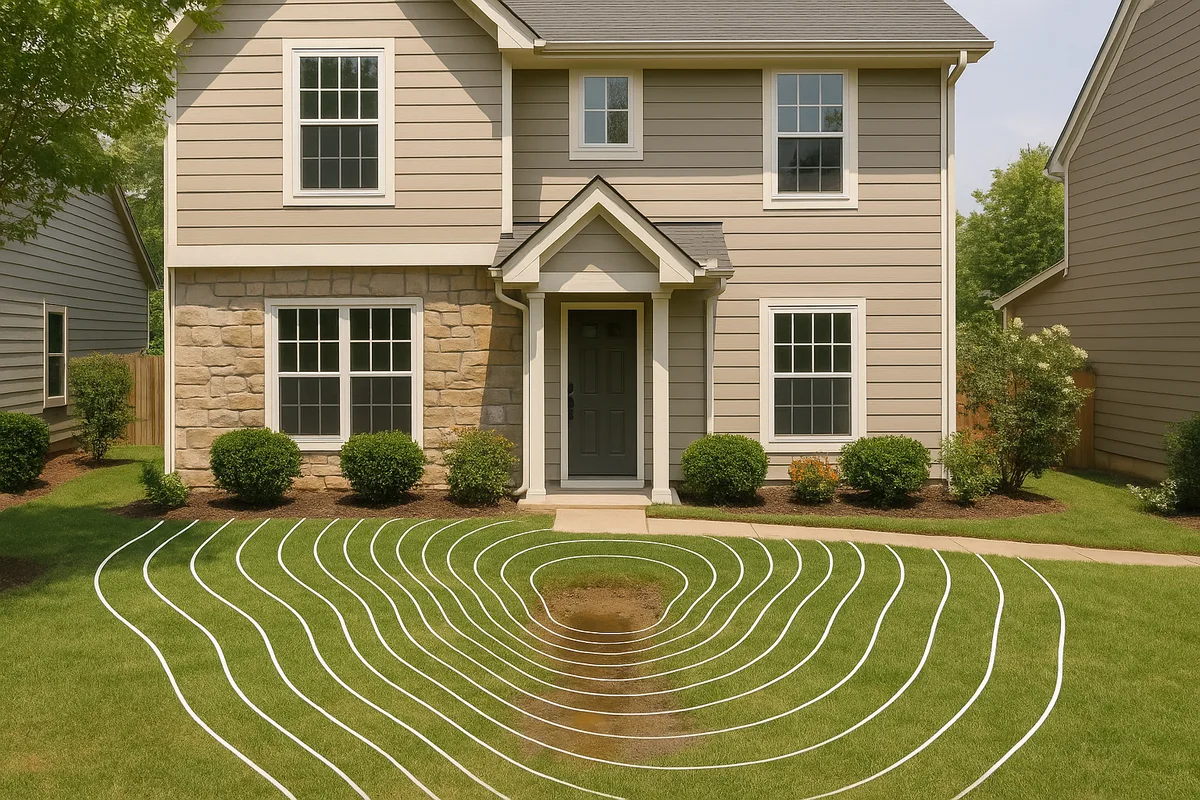
The most obvious drainage problem visible on a contour map is a closed depression—a set of concentric contour lines with hachure marks indicating that elevation decreases toward the center. This pattern represents a bowl or basin in the terrain with no surface outlet for water. Every drop of rain that falls within the contributing area of this depression will flow inward and collect at the low point.
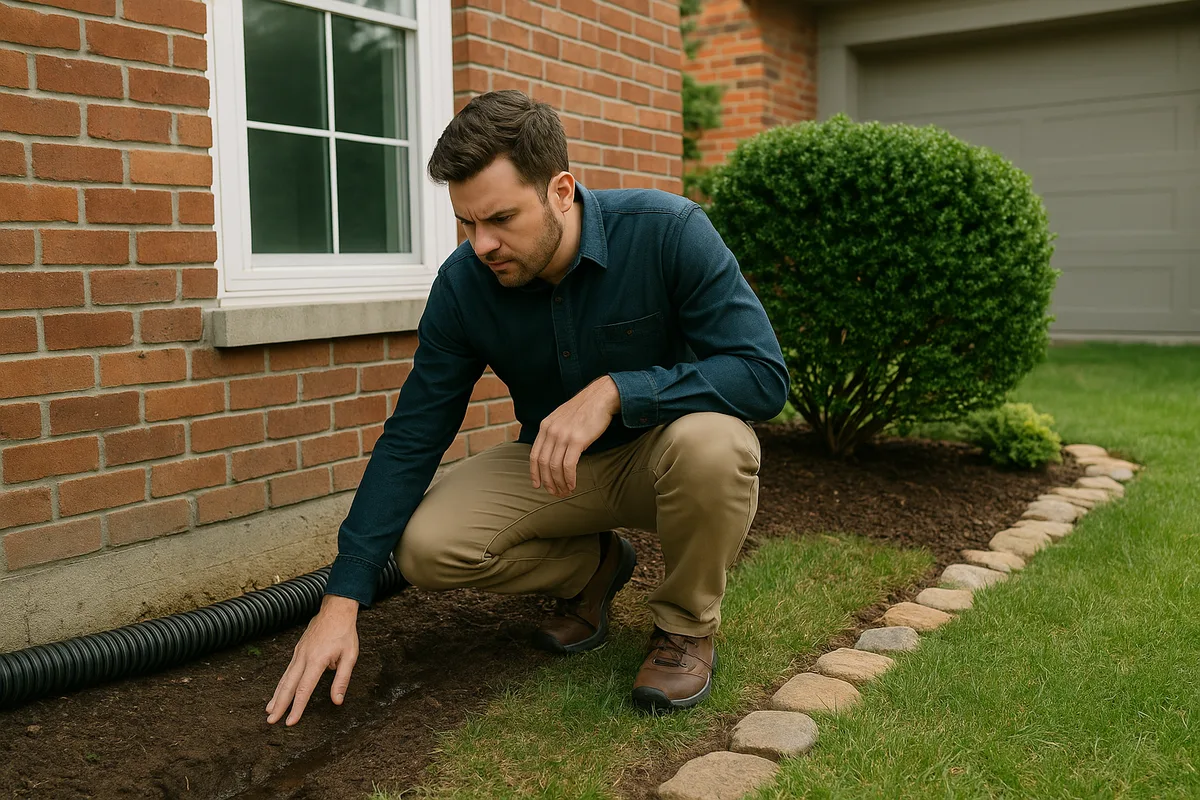
On residential properties, these depressions can range from broad, subtle swales that span an entire backyard to small, localized dips near a foundation wall. Even a depression just 3 to 4 inches deep can hold hundreds of gallons of water after a significant rain event. When these depressions are located adjacent to a foundation, they create sustained hydrostatic pressure against basement walls, leading to seepage, cracking, and eventual structural damage.
On a contour map with a 1-foot interval, a shallow depression might appear as a single closed contour loop. On a higher-resolution map with 3-inch or 6-inch intervals, the same depression might show as multiple nested rings, giving you a much clearer picture of its depth and extent. This is why high-resolution elevation data is so valuable for residential drainage analysis—the problems that matter most are often measured in inches.
Converging Contour Lines (Concentrated Flow Paths)
When contour lines bend to form V-shapes pointing toward higher elevations, they indicate a valley or swale where water from a broad area converges into a concentrated flow path. On a residential property, these convergence zones are where you'll find the highest volume and velocity of stormwater during rain events.
Converging flow paths become drainage problems when they direct concentrated water toward a structure, when they lack adequate capacity to handle peak flows, or when they terminate without a proper outlet. A common scenario is a natural swale that once carried water harmlessly across an undeveloped lot but now directs flow straight into a home's foundation because the house was sited without regard for the existing drainage pattern.
On a contour map, look for V-shaped contour bends that point toward your home. Trace the flow path upstream to identify the full contributing area—the zone of land from which water will funnel into that convergence point. The larger the contributing area, the more water you can expect during storms, and the more critical it is to manage that flow before it reaches your structure.
Flat Areas with Widely Spaced Contours
Areas where contour lines are very widely spaced—or where large zones fall between two contour lines with no intervening detail—indicate flat terrain. While flat land might seem benign, it's actually one of the most common sources of residential drainage problems because water has no gravitational incentive to move in any particular direction.
On flat terrain, even minor surface irregularities—a slight depression from soil settlement, a raised garden bed, or a poorly graded patio—can redirect water in unexpected ways. Without sufficient slope to overcome surface tension and friction, water sheets out across flat areas and ponds wherever it encounters any resistance to flow.
The challenge with flat areas on contour maps is that they can hide problems within the resolution of the contour interval. If your contour interval is 1 foot, a 4-inch depression in a flat area won't appear on the map at all—but it can still trap significant volumes of water. This is why sub-foot contour intervals, generated from LiDAR or detailed survey data, are essential for analyzing drainage on flat residential lots.
Contour Lines Bending Toward the Foundation
One of the most critical patterns to look for is contour lines that curve or bend toward your home's foundation. In a properly graded lot, contour lines near the house should bow outward—away from the structure—indicating that the ground slopes away in all directions. This pattern is sometimes called a "crown" or "positive drainage envelope."
When contour lines bend inward toward the foundation, they indicate that the ground slopes toward the house at that location. This is called negative drainage or reverse grading, and it's one of the most common and damaging drainage defects found during home inspections. Negative drainage directs surface water toward the foundation, where it saturates the backfill zone, increases hydrostatic pressure, and can infiltrate through cracks, joints, or porous concrete.
To evaluate your foundation drainage on a contour map, examine the contour lines within 10 feet of your home's perimeter on all sides. Every contour line should indicate higher elevation near the house and lower elevation farther away. If you find even one section where this pattern reverses, you've identified a drainage problem that warrants immediate attention.
Advanced Contour Analysis Techniques for Drainage
Beyond basic pattern recognition, several advanced techniques can extract even more drainage intelligence from contour data. These methods are used by drainage engineers, landscape architects, and the analytical tools we employ at Low Point Labs.
Watershed Delineation
A watershed (or catchment area) is the total area of land that drains to a single point. On a contour map, you can delineate a watershed by starting at the point of interest—say, your foundation's lowest corner—and tracing the ridgelines (contour V-shapes pointing downhill) that form the boundary of the contributing area. Every drop of rain that falls within this boundary will eventually flow to your point of interest.
Watershed delineation is crucial for drainage analysis because it tells you how much water your property must handle. A home sitting at the low point of a 2-acre watershed will receive far more stormwater than one at the low point of a quarter-acre watershed, even if the local grading around both homes is identical. Understanding your watershed size helps you determine whether your drainage infrastructure—gutters, downspout extensions, French drains, swales—is adequately sized for the volume of water it must manage.
Flow Accumulation Mapping
Flow accumulation analysis extends watershed delineation by calculating, for every point on the terrain, how many upstream cells contribute flow to that point. The result is a map that highlights the primary drainage channels and flow concentration zones across your property. High flow accumulation values indicate locations where large volumes of water converge—these are the natural drainage arteries of your landscape.
While flow accumulation mapping typically requires GIS software to compute from digital elevation models, the concept can be approximated visually on a contour map. Look for the deepest V-shaped contour bends (the most pronounced valleys) and trace them downstream. Where multiple valleys merge, flow accumulation increases, and the resulting drainage channel must handle the combined flow from all upstream contributing areas.
Cross-Sectional Profiles
Drawing cross-sectional profiles through critical areas of your property translates the plan-view contour map into a side-view elevation profile. This technique is especially useful for evaluating swale capacity, identifying subtle grade reversals, and communicating drainage issues to contractors.
To create a cross-section, draw a straight line across your contour map through the area of interest. At each point where the line crosses a contour, note the elevation and the horizontal distance from the start of the line. Plot these points on a graph with horizontal distance on the x-axis and elevation on the y-axis, and connect them with a smooth curve. The resulting profile shows the terrain surface as you would see it if you cut the earth along that line and looked at it from the side.
For foundation drainage analysis, draw cross-sections perpendicular to each wall of your home, extending at least 20 feet outward. The profile should show a consistent downward slope away from the foundation. Any flat spots, reverse slopes, or depressions in the profile represent drainage defects.
Aspect Analysis
Aspect refers to the compass direction that a slope faces. While primarily associated with solar exposure and vegetation analysis, aspect is also relevant to drainage because it determines the direction of surface water flow at every point on the terrain. An aspect map derived from contour data color-codes the landscape by flow direction, making it immediately apparent where water flows toward structures, property boundaries, or neighboring lots.
Aspect analysis is particularly valuable for identifying drainage patterns on complex terrain where contour lines alone can be difficult to interpret. On a property with multiple slope facets, an aspect map instantly reveals which areas drain toward the house, which drain toward the street, and which drain toward the neighbor's yard—information that's critical for designing effective drainage solutions.
Common Drainage Problems Identified Through Contour Analysis
Let's walk through the most common residential drainage problems and describe exactly how each one appears on a contour map. If you're examining your own property's topographic data, use this section as a diagnostic checklist.
Foundation Settlement Creating Reverse Grades
Over time, the backfill soil around a foundation settles, often creating a subtle trough or depression adjacent to the foundation wall. On a contour map, this appears as contour lines that parallel the foundation wall and indicate a low area immediately adjacent to the structure. In severe cases, you may see a closed depression (with hachure marks) running along one or more sides of the house.
This settlement typically occurs within the first 5 to 10 years after construction as the disturbed backfill soil compacts under its own weight and the influence of wetting and drying cycles. The resulting depression can be as shallow as 2 to 3 inches, but because it sits directly against the foundation, even this minor depression can channel significant water toward the most vulnerable part of the structure.
Impervious Surface Redirection
Driveways, patios, sidewalks, and other impervious surfaces alter natural drainage patterns by preventing infiltration and redirecting surface flow. On a contour map, the edges of impervious surfaces act as barriers or channels that modify the flow paths you'd predict from contour lines alone.
A common problem occurs when a driveway or patio creates an unintentional dam that traps water against the foundation. On the contour map, you might see adequate slope away from the house in the soil areas, but the impervious surface—which doesn't appear as a distinct feature on a contour-only map—blocks the flow path. This is why contour analysis for drainage should always be combined with an understanding of surface materials and structures.
Swale Obstructions and Grade Reversals
Many residential lots are designed with shallow swales—gentle V-shaped channels visible as subtle contour bends—that carry water from the backyard to the street or a stormwater inlet. Over time, these swales can be disrupted by landscaping changes, fence installation, soil accumulation, or tree root growth.
On a contour map, a functioning swale appears as a continuous V-shaped contour pattern with consistent downhill gradient along its length. A disrupted swale shows a break in this pattern—perhaps a flat spot where contour lines straighten out, or worse, a reverse grade where the V-shapes indicate water flowing backward along the swale. These obstructions cause water to back up and pond in the swale, often flooding the areas the swale was designed to protect.
Off-Site Drainage Contributions
Some of the most frustrating drainage problems originate off your property. If your lot sits at a lower elevation than neighboring properties—or if natural drainage channels cross from adjacent land onto yours—you may be receiving stormwater from a much larger area than your lot alone.
Contour analysis reveals this by showing contour lines that indicate slope from neighboring properties toward yours. By delineating the full watershed for your property's low point, you can determine exactly how much off-site area contributes flow to your lot. In some cases, homeowners discover that their backyard is the collection point for an entire block's worth of stormwater—a problem that no amount of on-site grading can fully solve without also addressing the upstream contributions.
Tools and Resources for Contour-Based Drainage Analysis
Accessing and interpreting contour data for your property has never been easier, thanks to publicly available elevation datasets and modern mapping tools.
Public Elevation Data Sources
The most comprehensive source of elevation data in the United States is the USGS 3D Elevation Program (3DEP), which is systematically collecting high-resolution LiDAR data for the entire country. Much of this data is already available for download and can be used to generate contour maps with intervals as fine as 6 inches or less. The USGS National Map Viewer provides an interactive interface for exploring available elevation data and downloading it for your area.
For properties in coastal areas, NOAA's Digital Coast program offers additional elevation datasets that may include more recent or higher-resolution coverage than what's available through 3DEP. Many county and municipal GIS departments also maintain their own LiDAR-derived elevation data, often at resolutions exceeding what's available from federal sources.
Interpreting Professional Survey Contours
If you've had a professional land survey or site plan prepared for your property, it likely includes contour lines. These survey-grade contours are typically the most accurate data available for your specific lot, as they're derived from ground-level measurements rather than aerial LiDAR.
When reviewing survey contours, pay attention to the contour interval. Many residential surveys use 1-foot contours, which may be too coarse to reveal the subtle grade changes that cause drainage problems. If your survey shows your entire yard falling between two contour lines (meaning less than 1 foot of total elevation change), the contour map alone won't reveal the micro-topography that determines drainage patterns. In these cases, spot elevations—individual elevation measurements at specific points—provide the detail needed to supplement the contour data.
Digital Elevation Models and GIS Analysis
For the most thorough contour lines drainage analysis, digital elevation models (DEMs) processed through GIS software provide capabilities that far exceed what's possible with paper contour maps. GIS tools can automatically calculate slope, aspect, flow direction, flow accumulation, and watershed boundaries for every point on your property.
Open-source GIS platforms like QGIS can import publicly available LiDAR data, generate contour maps at any desired interval, and perform hydrological analysis. While there's a learning curve, these tools put professional-grade drainage analysis capabilities in the hands of anyone willing to invest the time to learn them.
That said, the raw data and automated analysis are only as good as the interpretation applied to them. Automated flow models don't account for subsurface drainage infrastructure, culverts, building footprints, or other features that modify surface drainage patterns. Expert interpretation—combining contour analysis with field observation and engineering judgment—is what transforms raw data into actionable drainage intelligence.
From Contour Analysis to Drainage Solutions
Identifying drainage problems through contour analysis is only the first step. The real value comes from using that understanding to design effective solutions. Here's how contour-based insights translate into practical drainage interventions.
Regrading to Establish Positive Drainage
When contour analysis reveals negative drainage (slope toward the foundation), the most direct solution is regrading—physically reshaping the terrain to establish positive slope away from the structure. The target is a minimum 2% slope (1/4 inch per foot) for the first 6 to 10 feet from the foundation, with the ideal being 5% or greater where feasible.
On a contour map, successful regrading transforms inward-bowing contour lines into outward-bowing ones around the entire foundation perimeter. The amount of fill material needed can be estimated directly from the contour data by calculating the difference between existing grades and proposed grades at multiple points around the house.
Swale Design Using Contour Data
Swales are shallow, vegetated channels designed to collect and convey surface water. Contour analysis informs swale design by identifying the optimal alignment (following natural low points in the terrain), the required depth and width (based on the contributing watershed area and expected flow volume), and the necessary gradient (typically 1–3% along the swale's length).
On a contour map, a well-designed swale appears as a set of V-shaped contour bends with consistent spacing along the swale's length, indicating a uniform downhill gradient. The V-shapes should deepen gradually from the swale's head to its outlet, reflecting the increasing flow volume as the swale collects water along its length.
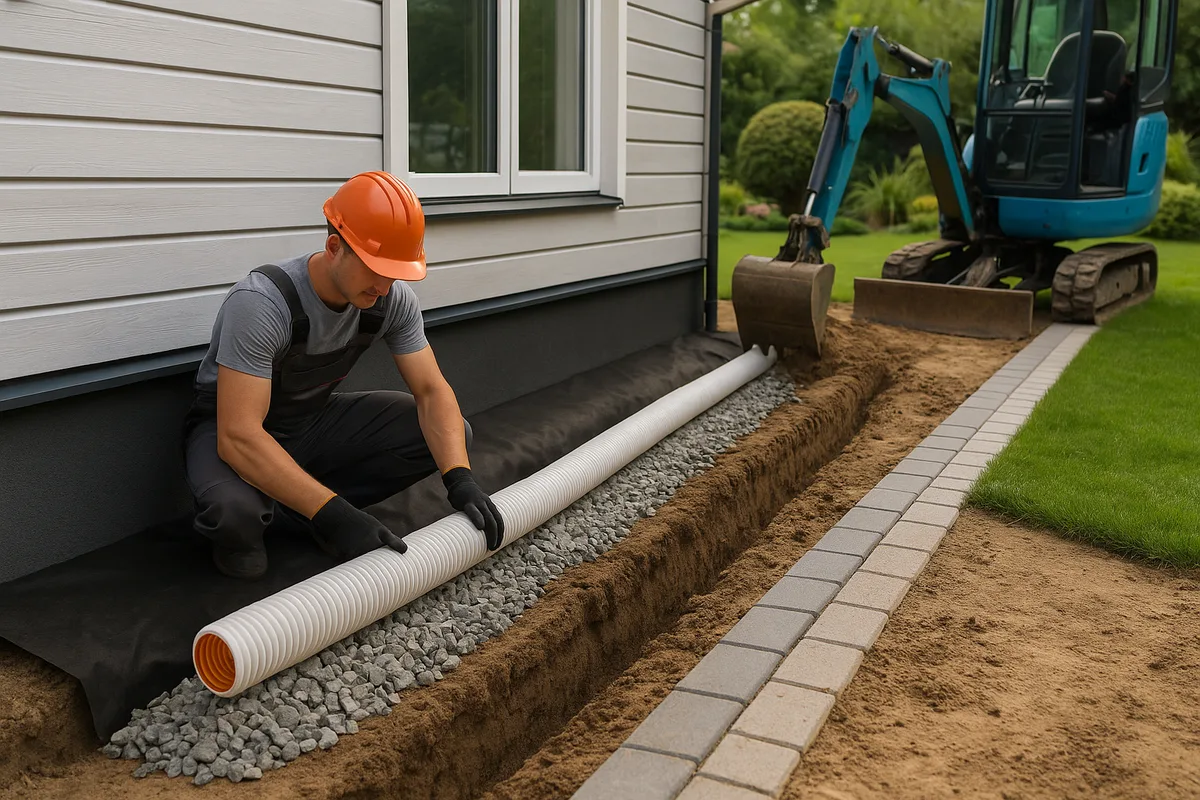
French Drain and Subsurface Drainage Placement
Contour analysis identifies where subsurface drainage systems like French drains will be most effective. French drains should be placed along the uphill side of the problem area—intercepting groundwater and surface infiltration before it reaches the foundation or saturates the problem zone.
The contour map reveals the uphill direction at every point, making it straightforward to determine the optimal placement for interceptor drains. The drain's invert (bottom) elevation should be set below the elevation of the area being protected, and the outlet must discharge to a point at a lower elevation with sufficient capacity to handle the collected water.
Dry Wells and Infiltration for Closed Depressions
When contour analysis reveals a closed depression with no surface outlet, and regrading to create an outlet isn't feasible, subsurface infiltration may be the solution. Dry wells, infiltration trenches, and rain gardens can be installed at the low point of the depression to capture collected water and allow it to infiltrate into the soil.
The feasibility of infiltration solutions depends heavily on soil type and the depth to the water table. Clay-heavy soils with low permeability may not infiltrate water fast enough to prevent surface ponding during heavy rain events. Soil data from the NRCS Web Soil Survey can help you evaluate infiltration potential before committing to a subsurface solution.
Why Professional Contour Analysis Makes the Difference
While the principles of contour-based drainage analysis are accessible to anyone, professional analysis combines high-resolution data, specialized tools, and field experience to deliver insights that DIY approaches often miss. The difference between a homeowner looking at a contour map and a drainage professional analyzing one is similar to the difference between a patient reading their own X-ray and a radiologist interpreting it—the data is the same, but the depth of interpretation is vastly different.
Professional contour lines drainage analysis accounts for factors that don't appear on any contour map: the permeability of different soil zones, the location and condition of existing drainage infrastructure, the impact of seasonal water table fluctuations, the interaction between surface drainage and subsurface hydrology, and the regulatory requirements that govern stormwater management in your jurisdiction.
At Low Point Labs, our topographic drainage intelligence services combine high-resolution elevation data with expert interpretation to give you a complete picture of how water moves across your property. We don't just identify where the problems are—we explain why they exist, how severe they are, and what it will take to fix them. Our analysis examines topographic drainage patterns at a resolution fine enough to capture the subtle grade changes that cause real-world drainage failures.
If you've noticed standing water, foundation moisture, or erosion on your property, the answers are encoded in your terrain's contour lines. Contact Low Point Labs to explore our drainage assessment services and discover what your property's topography is trying to tell you.
Get Your Drainage Intelligence Report™
Start a free trial and generate reports on demand.
Frequently Asked Questions
Related Articles
How to Identify Hidden Drainage Failures Before They Become Expensive
Modern Construction Techniques for Drainage & Foundation Work