How to Use Visuals to Help Customers Understand Their Property
Every drainage contractor has experienced it: you're standing in a customer's backyard, explaining how water flows from the high point near the fence line down toward the foundation, and their eyes glaze over. They can see the puddle. They can feel the soggy ground. But they can't connect what you're describing — slopes measured in fractions of a percent, subsurface flow paths, soil permeability — to the reality under their feet. This is where drainage visuals change everything.
The gap between what a contractor knows and what a homeowner understands is one of the biggest obstacles in the drainage industry. It leads to lost bids, scope disputes, change orders, and customers who never fully appreciate the value of the work they paid for. Visual communication — through site diagrams, elevation overlays, annotated photos, and topographic maps — bridges that gap. It transforms abstract concepts into something a homeowner can see, understand, and act on.
This guide is for contractors, inspectors, and property professionals who want to elevate their customer communication using visuals. We'll cover the types of visuals that work, how to create them efficiently, and why investing in visual presentation isn't just good salesmanship — it's good practice.
Why Words Alone Fail in Drainage Communication
Drainage is inherently spatial. Water doesn't care about property lines, and it doesn't follow straight paths. It responds to topography, soil type, impervious surfaces, and dozens of micro-conditions that vary across even a small residential lot. When a contractor tries to explain this verbally — "the grade drops about three inches over twenty feet toward the southeast corner" — most homeowners simply cannot construct an accurate mental picture.
This isn't a reflection of intelligence. Spatial reasoning under field conditions is a specialized skill that contractors develop over years. Homeowners think in rooms, walls, and fences. Contractors think in contours, watersheds, and flow vectors. Without a visual bridge, these two mental models never connect.
The consequences are real. A homeowner who doesn't understand the problem is less likely to approve a comprehensive solution. They'll question why you need to regrade 40 feet of yard when the puddle is only in one spot. They'll push back on costs because they can't see the scope of work mapped to the scope of the problem. And if something goes wrong — or even if the project goes perfectly but looks different than they imagined — you'll face disputes rooted in misaligned expectations.
Contractor visuals solve this by externalizing your expertise. Instead of asking the customer to build a mental model from your words, you hand them a picture. Research in cognitive science consistently shows that people retain 65% of information presented visually compared to only 10% of information presented verbally. For contractors, this translates directly to better-informed customers, smoother projects, and fewer callbacks.
Get Your Drainage Intelligence Report™
Start a free trial and generate reports on demand.
Types of Visuals That Work for Property Drainage
Not all visuals are created equal. The right format depends on what you're trying to communicate — the existing problem, the proposed solution, or the technical justification for your approach. Here are the most effective categories of drainage visuals for residential property work.
Annotated Photographs
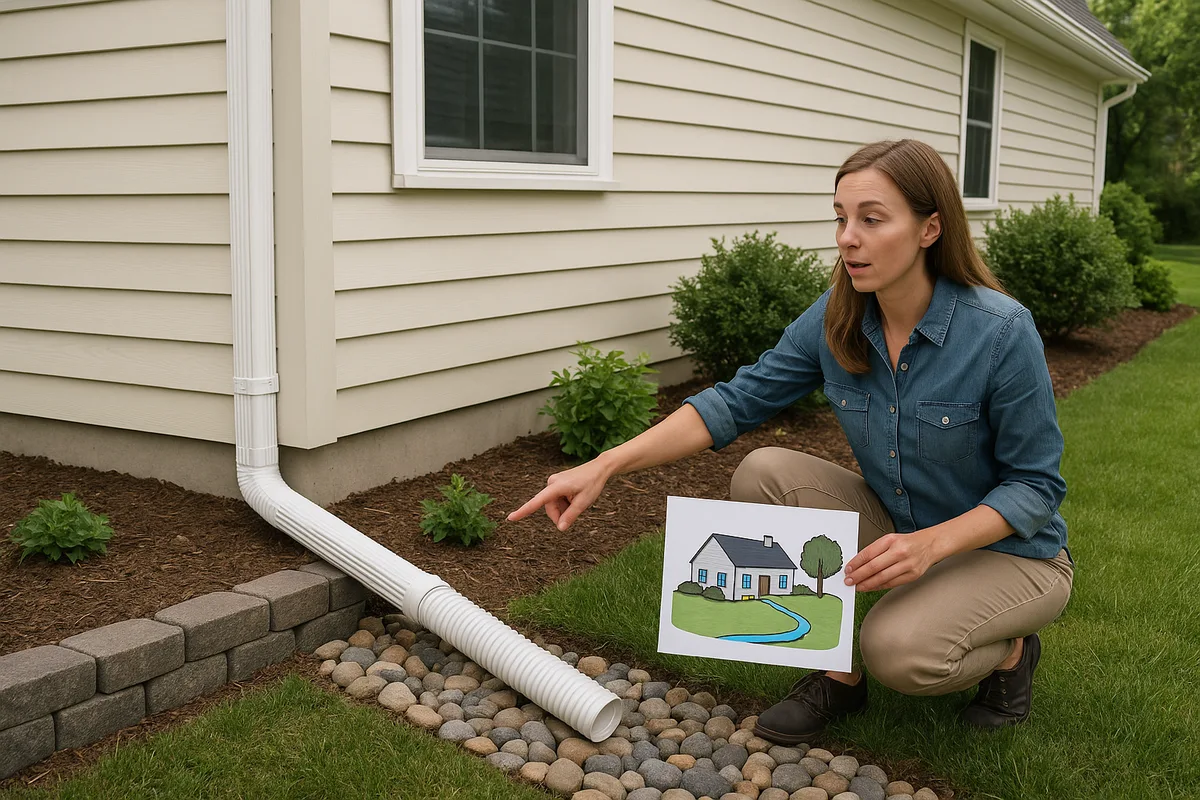
The simplest and most immediately powerful visual is a photograph of the customer's own property with annotations overlaid. Using a tablet or even a printed photo with a marker, you can draw arrows showing water flow direction, circle problem areas, and label features like downspout discharge points, low spots, and grade breaks.
Annotated photos work because they start with something the homeowner already recognizes — their own yard. There's no abstraction to overcome. When you draw a blue arrow from the neighbor's lot across the property line and into the foundation area, the homeowner instantly understands the source of their problem in a way that ten minutes of verbal explanation might not achieve.
Modern tools make this even easier. Apps like Markup Hero, Skitch, or even the native markup tools on an iPad let you annotate photos in real time during a site visit. Save these annotated images as part of your proposal package, and you've created a visual record that the homeowner can review later — and show to their spouse, who wasn't at the consultation.
Site Diagrams and Plan-View Drawings
A site diagram is a bird's-eye view of the property showing key features: the house footprint, driveway, walkways, fences, trees, and — most importantly — drainage infrastructure and flow paths. These don't need to be CAD-quality drawings. A clean sketch on graph paper, or a simple diagram created in a tool like Canva or PowerPoint, communicates effectively.
The power of a site diagram is that it shows relationships. A homeowner looking at a plan view can see that the downspout on the north side of the house discharges toward the patio, which slopes toward the foundation, which is where the basement leaks. These spatial relationships are nearly impossible to convey verbally but become obvious in a diagram.
For drainage contractors, site diagrams are also invaluable for showing proposed solutions. Draw the existing conditions in one color and the proposed drainage system — French drains, catch basins, discharge points — in another. The homeowner can see exactly what you're proposing, where it goes, and how it connects to the existing landscape.
Topographic and Elevation Visuals
Topographic data is the foundation of drainage analysis, but raw contour maps are intimidating to most homeowners. The key is translating topographic data into intuitive visuals. Color-coded elevation maps — where low areas are blue or green and high areas are red or orange — immediately communicate the terrain in a way that contour lines alone cannot.
Tools like the USGS National Map Viewer provide free access to elevation data that can be used to generate these visuals. For higher-resolution needs, LiDAR data from the USGS 3D Elevation Program offers sub-foot accuracy that can reveal micro-topographic features relevant to residential drainage.
At Low Point Labs, we specialize in turning this raw elevation data into actionable, customer-friendly visuals. Our drainage intelligence reports include color-coded elevation maps, flow accumulation overlays, and low-point identification — all designed to make complex topographic data accessible to homeowners and contractors alike.
Cross-Section Diagrams
Some drainage concepts are best explained in profile rather than plan view. A cross-section diagram — a side view showing the ground surface, foundation, and subsurface features — is ideal for explaining concepts like:
- Why the grade needs to slope away from the foundation (minimum 6 inches of fall over the first 10 feet, per most building codes)
- How a French drain works below the surface
- Where the water table sits relative to the basement floor
- How soil layers affect water movement
Cross-sections are particularly effective for foundation waterproofing discussions, where much of the relevant action happens underground and is literally invisible to the homeowner.
Before-and-After Comparisons
Nothing sells the value of drainage work like a before-and-after comparison. This can take several forms: side-by-side photos of a yard during rain events (before and after drainage installation), overlaid site diagrams showing flow paths before and after regrading, or even simple elevation profile comparisons.
Before-and-after visuals serve double duty. During the sales process, they demonstrate your past results and build confidence. After project completion, they document the improvement and justify the investment — which matters when the homeowner is deciding whether to refer you to their neighbor.
Building a Visual Presentation for Customer Consultations
Knowing which visuals work is only half the equation. The other half is assembling them into a coherent visual presentation that guides the customer from problem identification to solution approval. Here's a framework that works.
Start With What They See
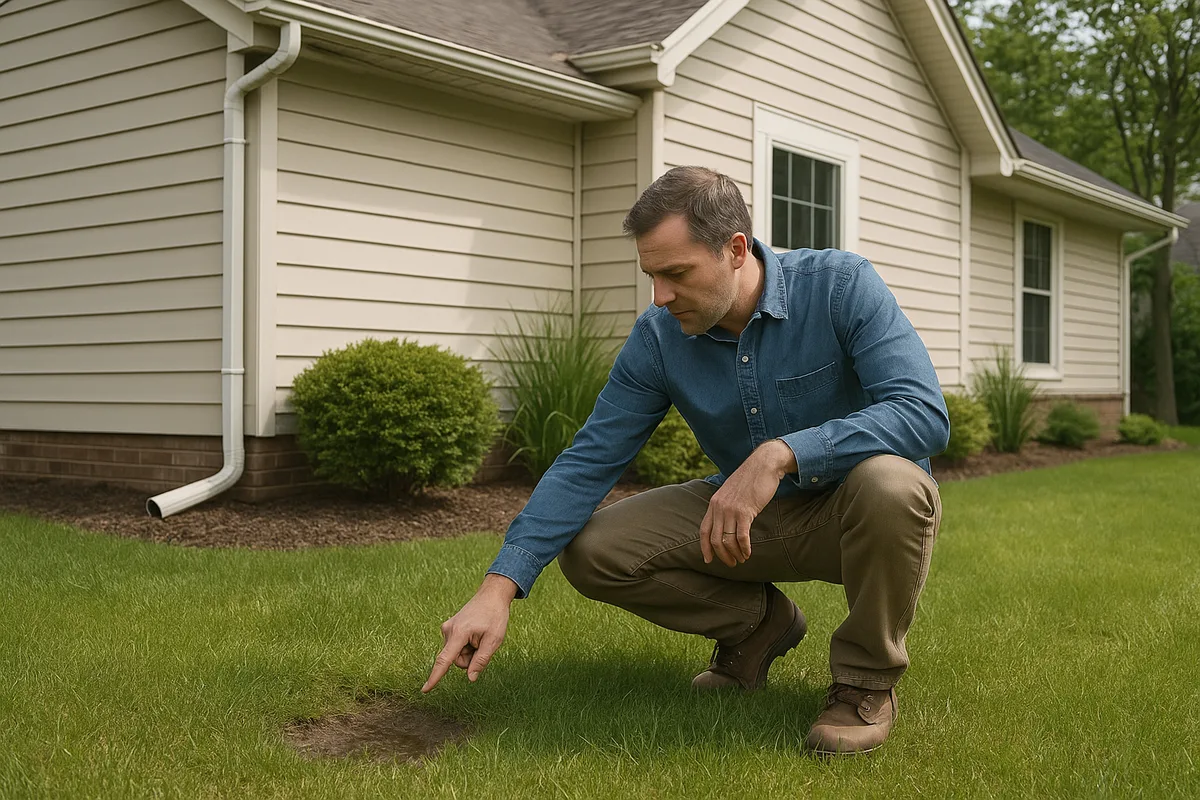
Open with photos of their property — ideally taken during or after a rain event, showing standing water, erosion, or saturated soil. If you can't capture rain-event photos, use dry-weather photos with annotations pointing out telltale signs: staining on foundation walls, sediment deposits, moss or algae growth, and erosion channels.
This validates the customer's concern. They called you because they noticed a problem, and your first visual should confirm that their instinct was correct. This builds trust immediately.
Show What They Can't See
Next, introduce the data layer. This is where topographic maps, soil data, and elevation analysis come in. Show them a color-coded elevation map of their property and point out the low spots, the flow paths, and the areas where water concentrates.
This is the "aha" moment in most consultations. The homeowner has been looking at their flat-seeming yard for years, never realizing that there's a subtle 1.5% grade directing water from 3,000 square feet of uphill area directly toward their foundation. When they see it on a map — with colors making the elevation differences obvious — the problem suddenly makes sense in a way it never did before.
You can enhance this step with soil data from the NRCS Web Soil Survey, which provides free information about soil types, drainage characteristics, and hydrologic soil groups for any property in the United States. Showing a homeowner that their lot sits on Group D soils (the slowest-draining category) explains why water sits on the surface for days after rain.
Present the Solution Visually
With the problem clearly established, present your proposed solution using a site diagram. Show the proposed drainage system overlaid on the property plan. Use different colors or line styles to distinguish between existing features and new installations. Label each component — French drain, catch basin, pop-up emitter, channel drain — so the homeowner can follow along.
Include dimensions and slopes where relevant. "This French drain will run 45 feet along the east side of the house at a 1% slope, discharging to a pop-up emitter near the street" is much more compelling when the homeowner can see it drawn on a map of their property.
Close With Context
End your presentation with context that reinforces value. This might include:
- A cross-section showing how the proposed system protects the foundation
- Before-and-after photos from a similar project you completed
- A simple diagram showing the cost of water damage versus the cost of prevention
- A maintenance schedule with visual callouts for each component
This final section transforms your proposal from a line-item estimate into a professional recommendation backed by data and expertise.
Tools and Technology for Creating Contractor Visuals
You don't need to be a graphic designer to create effective drainage visuals. The technology landscape has evolved to the point where professional-quality visuals are accessible to any contractor willing to invest a small amount of time.
Free and Low-Cost Diagramming Tools
For site diagrams and plan-view drawings, tools like Google Drawings, Canva, and Lucidchart offer drag-and-drop interfaces that make it easy to create clean, professional diagrams. Many contractors use these tools to create reusable templates — a standard site diagram layout that they customize for each property by adjusting the house footprint, lot shape, and drainage features.
For more technical drawings, SketchUp Free provides 3D modeling capabilities that can be surprisingly effective for showing customers how a drainage system will look and function. The learning curve is moderate, but the results are impressive.
Photo Annotation and Markup
Tablet-based markup is perhaps the single highest-ROI visual tool for field contractors. An iPad with Apple Pencil (or equivalent Android setup) lets you photograph the property, annotate it with flow arrows and labels in real time, and share the marked-up image with the customer before you leave the site.
Apps like Notability, GoodNotes, and even the built-in Photos markup on iOS make this workflow seamless. The key is developing a consistent visual language — blue arrows for water flow, red circles for problem areas, green lines for proposed solutions — so your annotations are immediately readable.
GIS and Mapping Platforms
For contractors who want to take their visual game to the next level, GIS (Geographic Information System) tools provide access to elevation data, aerial imagery, parcel boundaries, and soil maps that can be layered together into powerful property analysis visuals.
QGIS is a free, open-source GIS platform that can import elevation data, generate contour maps, and create color-coded terrain visualizations. The learning curve is steeper than consumer tools, but the analytical capabilities are professional-grade.
Alternatively, services like Low Point Labs handle the GIS analysis and produce customer-ready visuals that contractors can incorporate directly into their proposals. This lets contractors benefit from advanced topographic intelligence without needing to develop GIS expertise in-house.
Drone Photography and Video
Drones have become increasingly common in construction and landscaping, and they're particularly valuable for drainage work. An aerial photo or video of a property during a rain event provides dramatic, undeniable evidence of drainage problems. Even in dry conditions, aerial photography gives you the bird's-eye perspective that makes site diagrams intuitive.
If you're investing in a drone, look for models with photogrammetry capabilities. These can generate 3D terrain models from overlapping photographs, providing elevation data that rivals traditional survey methods at a fraction of the cost.
The Psychology of Visual Communication in Sales
Using visuals isn't just a communication technique — it's a sales strategy rooted in psychology. Understanding why visuals work helps you use them more effectively.
Reducing Perceived Risk
Drainage work is expensive, disruptive, and largely invisible once completed. From the homeowner's perspective, they're being asked to spend thousands of dollars to bury pipes in their yard that they'll never see again. This creates significant perceived risk: "Am I really getting what I'm paying for?"
Visuals reduce this risk by making the invisible visible. A detailed site diagram showing every foot of French drain, every catch basin, and every connection point reassures the homeowner that they're getting a comprehensive, well-planned system — not just a trench dug in the general direction of the problem.
Building Authority and Trust
When a contractor shows up with annotated photos, elevation maps, and professional site diagrams, they signal competence. The homeowner immediately perceives this contractor as more knowledgeable, more prepared, and more trustworthy than the competitor who showed up with nothing but a verbal estimate.
This perception isn't superficial. A contractor who takes the time to analyze the property visually genuinely does understand the problem better than one who doesn't. The visual presentation is both a signal and a substance of expertise.
Facilitating Decision-Making
Homeowners often need to discuss major expenses with a partner or family member who wasn't present at the consultation. When your proposal includes clear visuals, the homeowner can effectively re-present your analysis and recommendation to their spouse. Without visuals, the message degrades: "The contractor said something about the grade being wrong and we need a French drain." With visuals: "Look at this map — see how all the water from the neighbor's yard flows right to our foundation? Here's where they're going to put the drain."
This secondhand communication is one of the most underappreciated factors in close rates. The easier you make it for your customer to explain your proposal to someone else, the more likely you are to get the job.
Anchoring Value
Visuals help anchor the perceived value of your work. When a homeowner sees a site diagram showing 120 linear feet of French drain, four catch basins, two downspout connections, and a discharge system — all precisely mapped to their property — the price feels justified. Without that visual, the same scope of work is just a number on a piece of paper.
This is especially important in competitive bidding situations. If your competitor provides a one-line estimate ("French drain installation — $8,500") and you provide a visual package showing exactly what the customer gets for their money, you've fundamentally changed the comparison. You're no longer competing on price alone — you're competing on demonstrated understanding and professionalism.
Common Mistakes Contractors Make With Visuals
Visuals are powerful, but they can backfire if used poorly. Here are the most common mistakes to avoid.
Overcomplicating the Graphics
Engineering-grade drawings with dense contour lines, technical symbols, and jargon-filled labels will overwhelm most homeowners. Remember, the goal is communication, not documentation. Save the technical drawings for your crew and your permit applications. Customer-facing visuals should be clean, simple, and labeled in plain language.
A good test: if you showed the visual to a 12-year-old, could they identify where the water goes and where you're putting the drain? If not, simplify.
Using Generic Visuals Instead of Property-Specific Ones
Stock diagrams showing "how a French drain works" have their place, but they're no substitute for property-specific visuals. The homeowner wants to see their yard, their house, their problem. A generic cross-section of a French drain is educational; a site diagram showing a French drain mapped to their specific property is persuasive.
The most effective approach combines both: use generic diagrams to explain concepts, then use property-specific visuals to show application.
Neglecting the "After" Visual
Many contractors use visuals to diagnose the problem but then switch to verbal descriptions for the solution. This is a missed opportunity. The solution deserves the same visual treatment as the problem. Show the customer what their property will look like after the work is done — both in terms of drainage function (flow path diagrams) and aesthetic appearance (photos of similar completed projects).
Inconsistent Visual Language
If blue means water flow on one diagram and proposed pipe location on another, you'll confuse your customer. Develop a consistent color and symbol system across all your visuals:
- Blue: Water flow direction and accumulation
- Red: Problem areas and existing issues
- Green: Proposed solutions and new installations
- Yellow/Orange: Caution areas or areas requiring monitoring
- Dashed lines: Underground or proposed features
- Solid lines: Existing or surface features
Consistency makes your entire presentation more professional and easier to follow.
Scaling Visual Communication Across Your Business
Creating property-specific visuals for every consultation takes time. Here's how to make it scalable.
Develop Templates
Create reusable templates for your most common visual types. A standard site diagram template with placeholder elements, a cross-section template for French drain installations, a photo annotation template with your logo and consistent styling — these reduce the per-project effort from hours to minutes.
Systematize Your Process
Build visual creation into your standard workflow rather than treating it as an add-on. For example:
- Pre-visit: Pull aerial imagery and elevation data for the property. Generate a base map.
- Site visit: Photograph key areas. Take measurements. Annotate the base map with field observations.
- Post-visit: Finalize the site diagram with proposed solutions. Compile the visual package.
- Proposal delivery: Present visuals alongside the written estimate.
When visual creation is part of the process rather than extra work, it gets done consistently.
Leverage Third-Party Data Services
You don't have to generate all your data and visuals in-house. Services like Low Point Labs provide property-specific topographic analysis, drainage flow mapping, and low-point identification that contractors can incorporate into their proposals. This gives you access to professional-grade site diagrams and elevation analysis without investing in GIS software or surveying equipment.
Similarly, public data sources provide free information that enhances your visuals. Aerial imagery from Google Earth, soil data from the NRCS, and flood zone information from FEMA can all be incorporated into your visual presentations to add depth and authority.
Train Your Team
If you have multiple estimators or sales representatives, visual communication should be a core competency — not a skill that only one person on the team possesses. Develop training materials and standards so that every customer interaction includes consistent, professional visuals regardless of who conducts the consultation.
Measuring the Impact of Visual Communication
Like any business investment, visual communication should be measured. Track these metrics to understand the ROI of your visual strategy.
Close Rate
The most direct measure. Compare your close rate on proposals that include comprehensive visuals versus those that don't. Most contractors who implement visual communication report close rate improvements of 15-30%, though results vary by market and price point.
Average Project Value
Visuals often lead to larger projects because homeowners who understand the full scope of their drainage issues are more likely to approve comprehensive solutions rather than band-aid fixes. Track whether your average project value increases after implementing visual presentations.
Customer Satisfaction and Referrals
Customers who understand what was done and why are more satisfied with the outcome. They're also better equipped to explain the value of your work to neighbors and friends, leading to higher-quality referrals. Track referral rates and online review sentiment as indirect measures of communication effectiveness.
Dispute and Callback Rates
Poor communication leads to misaligned expectations, which lead to disputes and callbacks. If your visual communication strategy is working, you should see a measurable reduction in post-project issues.
Bringing It All Together: The Visual-First Contractor
The contractors who will thrive in the coming years are those who recognize that technical skill alone isn't enough. Homeowners have more choices than ever, and they increasingly expect the professionals they hire to communicate with clarity, transparency, and professionalism.
Drainage visuals aren't a gimmick or a nice-to-have. They're a fundamental business tool that improves every aspect of the customer relationship — from the first consultation through project completion and beyond. They help customers understand their property, trust your expertise, approve your recommendations, and appreciate the value of your work.
The investment required is modest. A tablet, a few apps, and a willingness to develop templates and processes will get you started. For the data layer — topographic analysis, elevation mapping, and flow path identification — Low Point Labs provides the intelligence that transforms good visuals into great ones.
Ready to give your customers the clarity they deserve? Explore Low Point Labs' drainage assessment services to access property-specific topographic intelligence, flow analysis, and customer-ready visuals that set your proposals apart. When your customers can see the problem and the solution, the decision to hire you becomes easy.
Get Your Drainage Intelligence Report™
Start a free trial and generate reports on demand.
Frequently Asked Questions
Related Articles
How Contractors Can Sell Solutions Instead of Selling Labor
How to Diagnose Yard Drainage Problems on a Site Walk