The Automated Watershed Map: The Tool Drainage Contractors Didn't Know They Needed
For decades, residential drainage contractors have relied on a combination of experience, visual inspection, and gut instinct to diagnose water problems on properties. Walk the lot, look for the obvious signs — standing water, eroded soil, stained foundation walls — and propose a solution. It works, mostly. But it also leaves enormous gaps in understanding, leads to undersized or poorly placed systems, and makes it nearly impossible to differentiate your bid from the next contractor's.
The watershed map changes all of that. Specifically, the automated watershed map — generated by modern drainage software using high-resolution elevation data — gives contractors something they've never had before: a complete, data-driven picture of every drop of water that flows across a property, where it comes from, and where it ends up. It's the tool drainage contractors didn't know they needed, and once they use it, they wonder how they ever worked without it.
This article breaks down what automated watershed maps are, how the underlying technology works, why they matter for residential drainage work, and how contractors can integrate this drainage software into their operations to win more bids, design better systems, and reduce costly callbacks.
What Is a Watershed Map and Why Does It Matter?
A watershed — sometimes called a catchment or drainage basin — is the area of land where all precipitation and surface water drains to a single outlet point. In large-scale hydrology, watersheds can span thousands of square miles. The Mississippi River watershed, for example, covers roughly 1.2 million square miles across 31 states. But the same principle applies at every scale, right down to an individual residential lot.
A watershed map is a visual representation of these drainage boundaries. It shows the dividing lines (ridgelines) that separate one drainage area from another, the flow paths water follows as it moves downhill, and the low points where water accumulates. When applied to a residential property, a watershed map reveals the micro-drainage patterns that determine whether a basement stays dry, whether a yard floods after a storm, and whether a retaining wall will eventually fail from hydrostatic pressure.
The reason this matters so much for drainage contractors is simple: you can't fix what you can't see. A property might have water problems caused by runoff originating 200 feet uphill on a neighbor's lot. Without a watershed map, a contractor might install a French drain along the foundation and call it done — only to get a callback six months later because the actual problem was never addressed. The watershed map reveals the full story, showing not just where water collects but the entire contributing area that feeds that collection point.
The Scale Problem in Residential Drainage
Traditionally, watershed delineation has been the domain of civil engineers and hydrologists working on large-scale projects — highway design, municipal stormwater systems, land development. The tools existed, but they required specialized GIS knowledge, expensive software licenses, and hours of manual work. For a residential drainage contractor bidding a $5,000 French drain installation, that level of analysis was simply impractical.
This created a persistent gap in the industry. Contractors working on the properties where drainage problems cause the most personal and financial damage — homes — were the least likely to have access to proper watershed analysis. Automated watershed mapping closes that gap by making the analysis fast, affordable, and accessible to professionals who don't have a degree in hydrology.
How Automated Watershed Delineation Works
Automated watershed delineation is a computational process that uses digital elevation models (DEMs) to determine how water flows across a landscape. The underlying algorithms have been refined over decades of academic and government research, but the core logic is surprisingly intuitive.
The Digital Elevation Model Foundation
Everything starts with elevation data. A digital elevation model is a grid of points, each with a known elevation value. The resolution of this grid — how closely spaced the points are — determines how much detail the analysis can capture. The USGS 3D Elevation Program (3DEP) has been systematically collecting high-resolution LiDAR data across the United States, providing elevation data at resolutions of 1 meter or better for much of the country. At 1-meter resolution, each pixel in the elevation grid represents a 3.3-foot square on the ground — detailed enough to capture subtle grade changes around a house, along a driveway, or across a backyard.
Higher-resolution data sources, including drone-collected LiDAR and photogrammetry, can push that resolution to 10 centimeters or less, capturing features like curb heights, window wells, and individual swales.
The Flow Direction and Accumulation Algorithm
Once the elevation data is in place, the drainage software processes it through a series of steps:
- Pit filling: Raw elevation data contains small depressions ("sinks") that may be data artifacts or real features. The algorithm fills these to create a hydrologically consistent surface, ensuring water can flow continuously downhill.
- Flow direction: For each cell in the grid, the algorithm determines which of its eight neighboring cells has the lowest elevation. Water is assumed to flow in that direction. This creates a flow direction raster — essentially a map of arrows showing which way water moves at every point on the property.
- Flow accumulation: The algorithm then counts how many upstream cells drain through each cell. Cells with high flow accumulation values represent concentrated flow paths — the streams, channels, and drainage corridors where water volume is highest.
- Watershed delineation: Given a specific outlet point (a storm drain, a low point in the yard, a foundation corner), the algorithm traces upstream through the flow direction grid to identify every cell that ultimately drains to that point. The boundary of that collection of cells is the watershed boundary.
The result is a precise, data-driven watershed map that shows exactly how much land area contributes runoff to any given point on the property.
From Raw Data to Actionable Intelligence
Modern drainage software doesn't stop at delineation. The best tools layer additional analysis on top of the watershed map: slope calculations that identify areas prone to erosion, volume estimates based on soil type and rainfall intensity, flow velocity calculations that inform pipe sizing, and visual overlays that make the data understandable to homeowners who've never seen a topographic map. This transformation of raw elevation data into actionable drainage intelligence is what makes automated watershed mapping so powerful for contractors.
Why Contractors Need Watershed Maps (Even If They Don't Think They Do)
Most experienced drainage contractors have developed an intuitive sense of how water moves across a property. They can read the landscape — the subtle dip in the lawn, the moss growing on the north side of the foundation, the erosion channel behind the downspout. This experience is valuable. But intuition has limits, and those limits cost money.
The Hidden Contributing Area Problem
One of the most common and costly mistakes in residential drainage is underestimating the contributing area. A contractor looks at a soggy backyard and designs a drainage system sized for the backyard alone. But the watershed map reveals that the backyard is actually collecting runoff from the neighbor's yard uphill, a section of the street, and a sloped common area behind the property line. The actual contributing area might be three to five times larger than what's visible from the property.
This matters because drainage system capacity is directly tied to contributing area and rainfall intensity. The Rational Method — the standard formula used for small watershed hydrology — calculates peak runoff as Q = CiA, where C is the runoff coefficient, i is rainfall intensity, and A is the contributing drainage area. If you underestimate A by a factor of three, your system is undersized by a factor of three. That's not a minor error. That's a system that overflows during exactly the storms it was designed to handle.
Winning Bids with Data
The residential drainage market is competitive. Homeowners often get three or four bids, and without a way to evaluate technical quality, they default to price. The contractor who shows up with a printed watershed map — showing the homeowner exactly where their water comes from, how much of it there is, and why the proposed solution addresses the root cause — has a massive advantage over the contractor who says, "Yeah, you need a French drain along there."
A watershed map transforms the sales conversation from opinion to evidence. It demonstrates competence, builds trust, and justifies pricing. Contractors who use drainage software to generate these maps consistently report higher close rates and higher average job values, because homeowners are willing to pay more when they understand the problem and trust the solution.
Reducing Callbacks and Liability
Callbacks are the silent profit killer in drainage contracting. A system that doesn't perform as expected leads to unhappy customers, warranty work, negative reviews, and potential liability. The most common root cause? The system was designed based on incomplete information about how water moves across the property.
An automated watershed map doesn't eliminate all risk, but it dramatically reduces the risk of designing a system that ignores a major contributing flow path. When every upstream acre is accounted for, pipe sizes are correct, inlet locations are optimized, and discharge points are properly located. The system works because it was designed with complete data, not partial observation.
What Modern Drainage Software Brings to the Table
The term drainage software covers a broad range of tools, from full-featured GIS platforms to specialized residential applications. For drainage contractors, the most relevant tools share several key capabilities.
Automated Analysis from Elevation Data
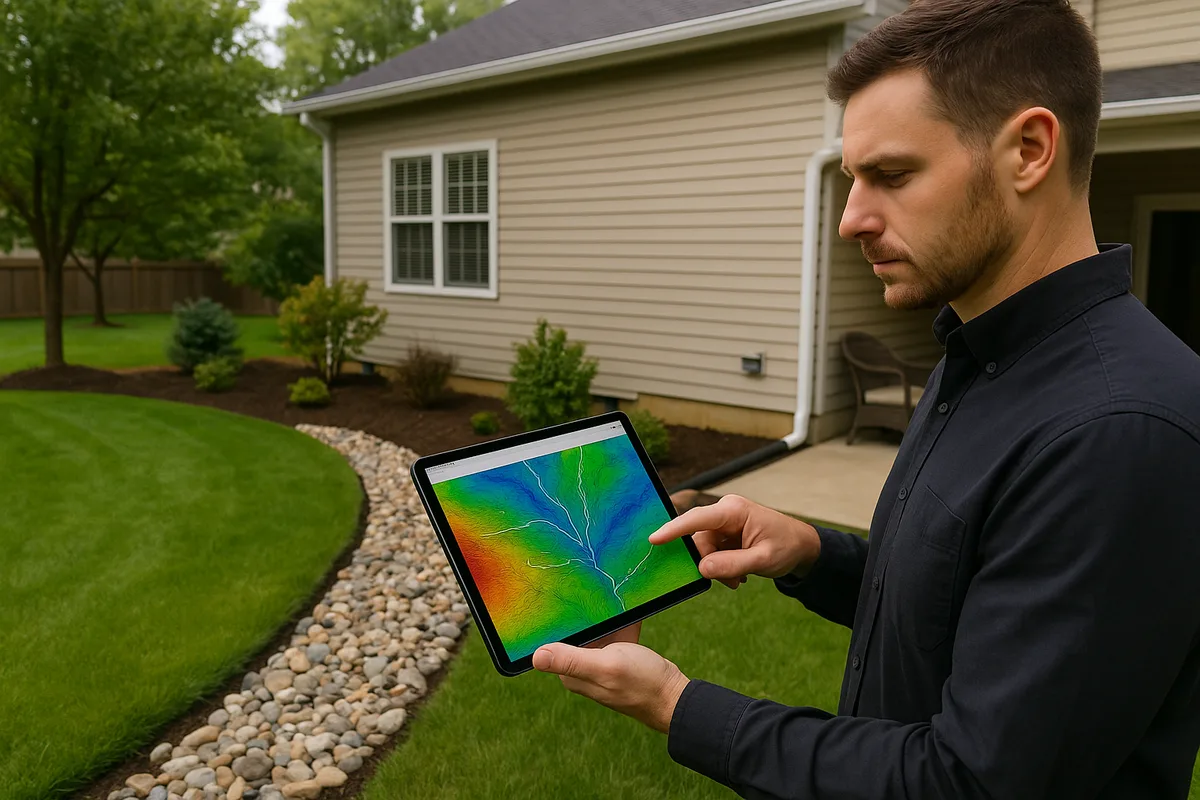
The core capability is automatic generation of watershed boundaries, flow paths, and accumulation maps from elevation data. The contractor doesn't need to manually trace contour lines or interpret topographic maps. The software handles the computational heavy lifting and presents results in a visual, intuitive format.
Some platforms allow contractors to simply enter a property address and receive a complete drainage analysis within minutes. This is a radical departure from the traditional workflow of scheduling a site visit, walking the property, taking manual measurements, and sketching a drainage plan on graph paper.
Slope and Grade Visualization
Beyond watershed delineation, drainage software typically includes slope analysis tools that color-code the property by grade percentage. This instantly highlights areas where the grade is insufficient (below the recommended 2% minimum slope away from foundations, per most building codes), areas where steep slopes create erosion risk, and flat areas where ponding is likely.
For contractors, this visualization is invaluable during both assessment and design. It shows where regrading is needed, where erosion control measures should be installed, and where the natural grade can be leveraged to move water without pumping.
Low Point and Depression Identification
Automated low point detection identifies every depression on the property — places where water will naturally collect with no outlet. Some of these are intentional (rain gardens, detention areas), but many are unintentional and problematic (the low spot in the yard where water sits for days after a rain, the area behind the garage where ice forms every winter).
Knowing the exact location, depth, and volume of every low point allows contractors to prioritize their work and design systems that address the most impactful problems first.
Report Generation and Client Communication
Perhaps the most underappreciated feature of modern drainage software is its ability to generate professional reports. A well-designed report includes annotated maps, drainage statistics, identified problem areas, and recommended solutions — all formatted in a way that homeowners can understand.
This report becomes a sales tool, a design document, and a record of the pre-construction conditions all in one. It elevates the contractor's professionalism and provides documentation that can be referenced if questions arise months or years later.
Practical Applications: How Contractors Use Watershed Maps in the Field
Theory is useful, but contractors care about practical application. Here's how automated watershed maps translate into better work on real projects.
Pre-Bid Site Assessment
Before ever visiting a property, a contractor can pull up an automated watershed map and understand the drainage dynamics. This pre-bid intelligence allows the contractor to arrive at the site visit with informed questions, a preliminary understanding of the problem, and a sense of the scope of work required. It also helps contractors identify jobs that are beyond their scope — for example, a property where the primary drainage problem originates on municipal land or involves utility easements — before investing time in a detailed proposal.
The pre-bid watershed map also helps with estimating. If the contributing area is 15,000 square feet and the local design storm produces 3.5 inches per hour (a value that can be determined from NOAA Atlas 14 precipitation frequency data), the contractor can calculate expected peak flow and size the system accordingly before setting foot on the property.
System Design and Pipe Sizing
Watershed area directly informs pipe sizing. A 4-inch perforated pipe is adequate for a French drain collecting groundwater seepage along a 40-foot foundation wall. But if that same drain is also intercepting surface runoff from a 10,000-square-foot contributing watershed, 4-inch pipe won't cut it. The watershed map quantifies the contributing area, allowing the contractor to calculate peak flow and select the appropriate pipe diameter.
Common residential pipe sizing guidelines based on contributing area and rainfall intensity:
- 4-inch pipe: Up to approximately 3,600 square feet of contributing area at moderate rainfall intensity
- 6-inch pipe: Approximately 3,600–8,100 square feet
- 8-inch pipe: Approximately 8,100–14,400 square feet
- 12-inch pipe: Larger contributing areas or high-intensity rainfall zones
These are rough guidelines — actual sizing depends on pipe material, slope, roughness coefficient, and local rainfall data — but the point is clear: without knowing the contributing area, you're guessing at pipe size. The watershed map eliminates the guesswork.
Inlet and Outlet Placement
Where you place catch basins, channel drains, and discharge points matters enormously. A catch basin placed 10 feet from the natural flow concentration point will miss a significant portion of the runoff it's supposed to capture. The watershed map shows exactly where flow paths converge, making inlet placement precise rather than approximate.
Similarly, discharge point selection requires understanding downstream drainage patterns. Discharging collected water into an area that drains back toward the house — or onto a neighbor's property — creates new problems. The watershed map shows the natural drainage corridors where discharge can be safely directed.
Documenting Existing Conditions
Before any work begins, the watershed map serves as a baseline document of existing drainage conditions. This is valuable for several reasons:
- It provides evidence of pre-existing problems that the contractor is not responsible for
- It documents the scope of the drainage issue for insurance claims or disputes
- It creates a before-and-after comparison that demonstrates the value of the completed work
- It can be shared with building inspectors or permitting authorities to support the proposed design
Communicating with Homeowners
Most homeowners don't understand drainage. They know their basement is wet or their yard floods, but they don't understand why. A watershed map is a powerful communication tool because it makes the invisible visible. When a homeowner can see that 8,000 square feet of their neighbor's property drains directly toward their foundation, the conversation shifts from "trust me, you need this" to "here's the data, here's the problem, here's the solution."
This visual communication also helps manage expectations. If the watershed map shows that a property receives runoff from a large uphill area, the contractor can explain why a simple surface regrade won't solve the problem and why a more comprehensive (and more expensive) system is warranted.
The Technology Behind the Transformation
The convergence of several technologies has made automated watershed mapping practical for residential drainage work.
LiDAR and High-Resolution Elevation Data
Light Detection and Ranging (LiDAR) technology uses laser pulses fired from aircraft to measure ground elevation with centimeter-level accuracy. The USGS 3DEP program has been systematically collecting LiDAR data across the country, with the goal of complete national coverage. As of 2026, the majority of the contiguous United States has LiDAR coverage at 1-meter resolution or better, with many urban and suburban areas covered at higher resolutions.
This data is the foundation of automated watershed mapping. Without accurate, high-resolution elevation data, the algorithms can't distinguish the subtle grade changes that control residential drainage. A 6-inch grade change over 50 feet — a 1% slope — is the difference between water flowing away from a foundation and water flowing toward it. Only high-resolution data captures this level of detail.
Cloud Computing and Processing Power
Watershed delineation algorithms are computationally intensive. Processing a high-resolution DEM for even a single residential lot involves millions of calculations. A decade ago, this required a powerful desktop workstation and specialized software. Today, cloud computing makes it possible to run these analyses on remote servers and deliver results to a contractor's tablet or smartphone in minutes.
This shift from desktop to cloud is what makes drainage software accessible to contractors who don't have GIS workstations or technical staff. The complexity is hidden behind a simple interface — enter an address, get a watershed map.
Machine Learning and Automated Feature Detection
Newer drainage software platforms are incorporating machine learning to automatically identify drainage-relevant features: culverts, storm drains, retaining walls, impervious surfaces, and building footprints. These features modify how water flows across the landscape in ways that raw elevation data alone can't capture. A retaining wall, for example, blocks sheet flow and redirects water along its face. A culvert allows water to pass under a driveway. Machine learning algorithms trained on aerial imagery and elevation data can detect these features and incorporate them into the drainage model automatically.
Integration with Soil Data
Watershed area tells you how much water arrives at a point, but soil type determines how much of that water infiltrates versus running off. Modern drainage software increasingly integrates with soil databases — like the NRCS Web Soil Survey — to automatically assign infiltration rates and hydrologic soil groups to the analysis area. A property on sandy loam (Hydrologic Soil Group A) with high infiltration rates will generate far less runoff than the same property on clay (Group D), even with identical watershed areas and rainfall.
This integration allows the drainage software to produce more accurate runoff estimates, which in turn leads to more appropriately sized drainage systems.
Overcoming Adoption Barriers: Why Some Contractors Hesitate
Despite the clear advantages, adoption of automated watershed mapping among residential drainage contractors has been gradual. Understanding the barriers helps address them.
"I've Been Doing This for 20 Years Without It"
Experience is valuable, and no technology replaces field knowledge. But experience and data are not mutually exclusive — they're complementary. The most effective contractors combine decades of field experience with data-driven analysis. The watershed map doesn't replace the contractor's judgment; it informs it. It confirms what the experienced eye suspects and reveals what even the experienced eye can miss.
Consider this analogy: a skilled carpenter can estimate a board's length by eye, but they still use a tape measure. The tape measure doesn't diminish their skill — it ensures accuracy. The watershed map is the drainage contractor's tape measure.
"My Customers Won't Pay for That"
This is a common misconception. Homeowners don't pay for the watershed map — they pay for the confidence and quality it enables. The map is a tool that helps the contractor design a better system, communicate more effectively, and justify appropriate pricing. Contractors who use drainage software consistently report that their average job value increases because homeowners understand the scope of the problem and the rationale for the solution.
Moreover, the cost of generating an automated watershed map is minimal compared to the cost of a callback. A single warranty repair on a failed drainage system can cost more than a year's subscription to drainage software.
"I Don't Know How to Use GIS Software"
This was a valid concern five years ago. Traditional GIS platforms like QGIS and ArcGIS are powerful but complex, with steep learning curves that make them impractical for most contractors. Modern drainage software designed for the residential market has eliminated this barrier. Purpose-built platforms abstract away the GIS complexity and present results in formats that any contractor can understand and use — color-coded maps, annotated reports, and straightforward measurements.
The question is no longer whether a contractor can use this technology. It's whether they can afford not to.
The Competitive Landscape Is Shifting
The drainage contracting industry is at an inflection point. Early adopters of automated watershed mapping and drainage software are already differentiating themselves in the market. They're winning bids against competitors who show up with nothing but a verbal estimate. They're designing systems that work the first time. They're building reputations as the data-driven professionals in a field that has historically been dominated by guesswork.
As homeowners become more informed — searching online for drainage solutions, reading reviews, comparing proposals — the contractors who can demonstrate technical competence with visual, data-backed assessments will increasingly dominate the market. The watershed map is not a nice-to-have. It's becoming the standard of care.
For contractors who want to stay competitive, the time to adopt is now. For homeowners who want to ensure their drainage problems are solved correctly the first time, the question to ask any contractor is simple: "Can you show me the watershed map?"
At Low Point Labs, we're building the drainage intelligence tools that make this possible. Our automated topographic analysis generates detailed watershed maps, identifies low points and flow paths, and delivers the data contractors and homeowners need to make informed drainage decisions. Whether you're a contractor looking to elevate your business or a homeowner trying to understand why your yard floods, explore what automated watershed mapping can reveal about your property.
See Drainage Intelligence in Practice
Talk with our team or request an invitation to the platform.
Frequently Asked Questions
A watershed map for a residential property shows the boundaries of every drainage area on and around the lot, the flow paths water follows across the surface, and the low points where water collects. It reveals how much land area contributes runoff to any given point, helping identify the root cause of drainage problems.
Drainage software uses high-resolution elevation data (typically from LiDAR) and runs flow direction and flow accumulation algorithms to determine how water moves across the landscape. It automatically identifies watershed boundaries, flow paths, and collection points without requiring manual interpretation of topographic maps.
No. Modern drainage software designed for residential applications abstracts away the complexity of traditional GIS platforms. Contractors can typically enter a property address and receive a complete watershed analysis with color-coded maps and reports, no GIS training required.
Watershed maps quantify the contributing drainage area for any point on the property. Combined with local rainfall intensity data, this area is used in the Rational Method (Q = CiA) to calculate peak runoff flow, which directly determines the pipe diameter needed to handle the water without overflowing.
Yes. One of the most valuable aspects of automated watershed mapping is that it analyzes terrain beyond the property boundaries. It can reveal that a significant portion of a homeowner's drainage problem originates from runoff flowing in from neighboring lots, streets, or common areas uphill.
Accuracy depends on the resolution of the elevation data. With 1-meter LiDAR data (widely available through the USGS 3DEP program), automated watershed maps can capture grade changes as small as a few inches, which is sufficient for most residential drainage analysis. Higher-resolution data from drones can improve accuracy further.
Related Articles
How to Calculate a Catchment Area Without Spending Hours on Google Earth
How to Cut Residential Site Assessment and Drainage Estimating Time by 70%