How to Cut Residential Site Assessment and Drainage Estimating Time by 70%
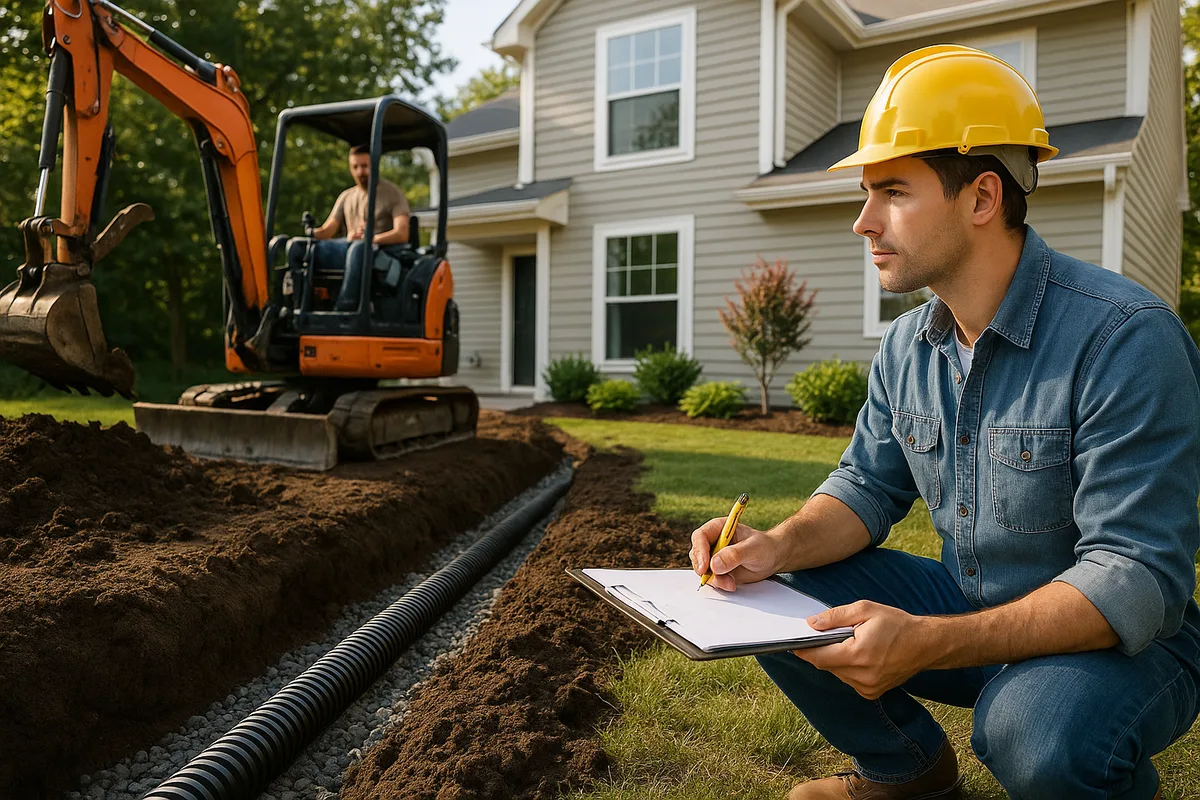
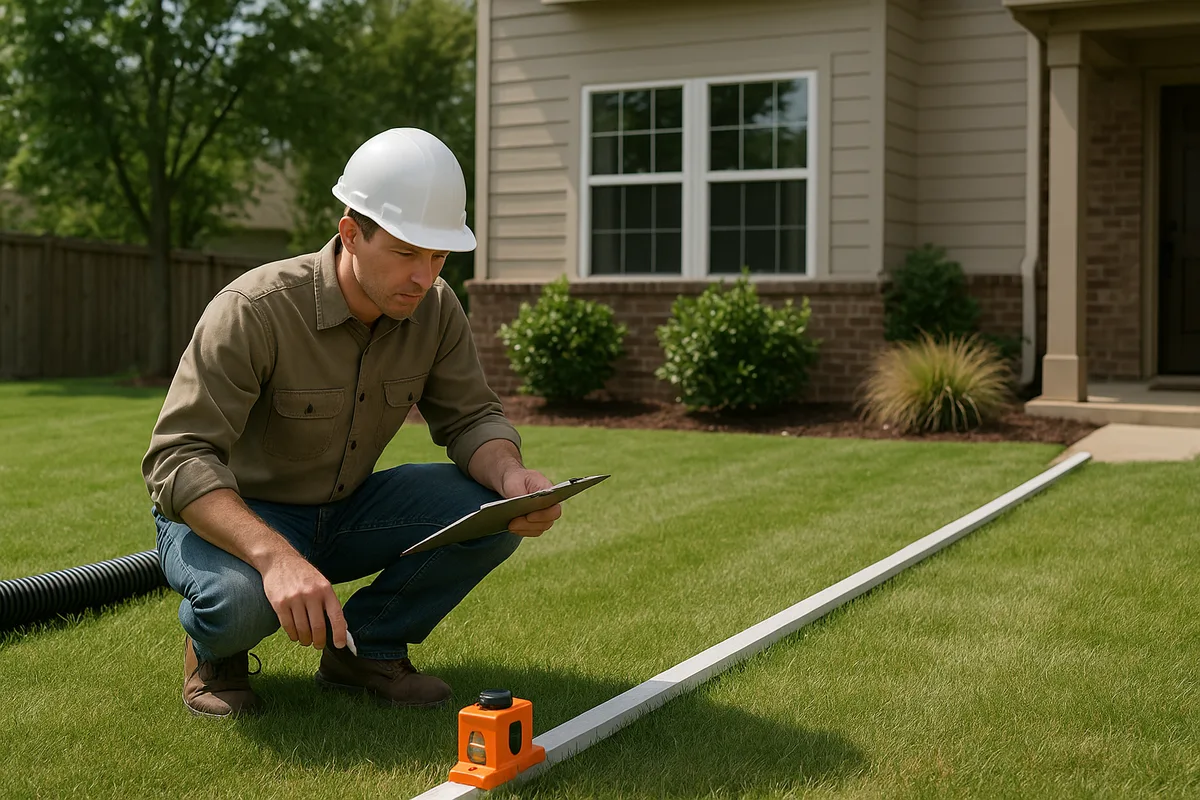
Every drainage contractor, home inspector, and grading professional knows the pain: you arrive at a residential property, spend two hours walking the lot with a transit level and tape measure, drive back to the office, manually calculate slopes and runoff volumes, sketch a rough plan, and then spend another hour or two building an estimate. By the time you deliver a quote, half a day is gone — for a single property.
The reality is that traditional site assessment and drainage estimating workflows were designed for an era before high-resolution elevation data, mobile GIS tools, and cloud-based estimation platforms existed. Professionals who still rely entirely on manual methods aren't just losing time — they're leaving money on the table, limiting the number of jobs they can bid, and often delivering less accurate results than their digitally equipped competitors.
This article lays out a comprehensive, field-tested framework for reducing your residential site assessment and drainage estimating time by up to 70%. We're not talking about cutting corners. We're talking about replacing redundant steps with smarter workflows, leveraging publicly available topographic data, systematizing your field observations, and automating the calculations that used to consume your afternoons. Whether you're a solo drainage contractor, a multi-crew landscaping company, or a home inspector adding drainage evaluations to your service offerings, these strategies will transform how you work.
The True Cost of Slow Site Assessment and Drainage Estimating
Before we dive into solutions, it's worth quantifying the problem. A typical residential drainage assessment — from initial site visit through delivered estimate — consumes between 4 and 8 hours when performed using traditional methods. That includes travel time, on-site measurement, office-based calculation, plan sketching, and estimate preparation. For a contractor running 3 to 5 estimates per week, that's 12 to 40 hours of unbillable time.
Let's put dollar figures on it. If your fully loaded hourly rate (including overhead, truck costs, and opportunity cost) is $85 per hour, and you spend an average of 6 hours per estimate, each bid costs you $510 in labor alone. If you close 40% of your bids, the cost of each won job includes roughly $1,275 in estimating overhead ($510 divided by 0.40). That overhead either eats into your margin or gets passed to the customer — neither of which is ideal.
The time problem compounds in other ways. Slow estimating means fewer bids per week, which means fewer jobs, which means less revenue. It also means longer response times to homeowner inquiries. In a competitive market, the contractor who delivers a professional, detailed estimate within 48 hours wins the job over the one who takes a week. Speed isn't just about efficiency — it's a competitive advantage.
There's also an accuracy dimension. Manual slope measurements taken with a builder's level at a handful of points across a property provide a sparse picture of the terrain. You might catch the obvious low point near the foundation but miss the subtle ridge 40 feet out that's actually redirecting sheet flow toward the neighbor's yard. More data, gathered faster, leads to better assessments and more accurate estimates.
Get Your Drainage Intelligence Report™
Start a free trial and generate reports on demand.
Phase 1: Pre-Visit Desktop Analysis Using Digital Elevation Data
The single biggest time savings comes from doing substantial analysis before you ever set foot on the property. Modern publicly available elevation datasets allow you to understand a site's topography, drainage patterns, and potential problem areas from your office or truck.
Leveraging LiDAR and 3DEP Data
The USGS 3D Elevation Program (3DEP) has produced high-resolution LiDAR-derived elevation data covering most of the continental United States. This data, typically available at 1-meter resolution or better, is accurate enough to identify slopes, swales, ridgelines, and low points on residential lots. For drainage professionals, this is transformative.
Here's a practical pre-visit workflow using 3DEP data:
- Pull the property address and identify the parcel boundaries using your county GIS portal or a tool like Google Earth.
- Download the DEM (Digital Elevation Model) for the area from the USGS National Map Downloader.
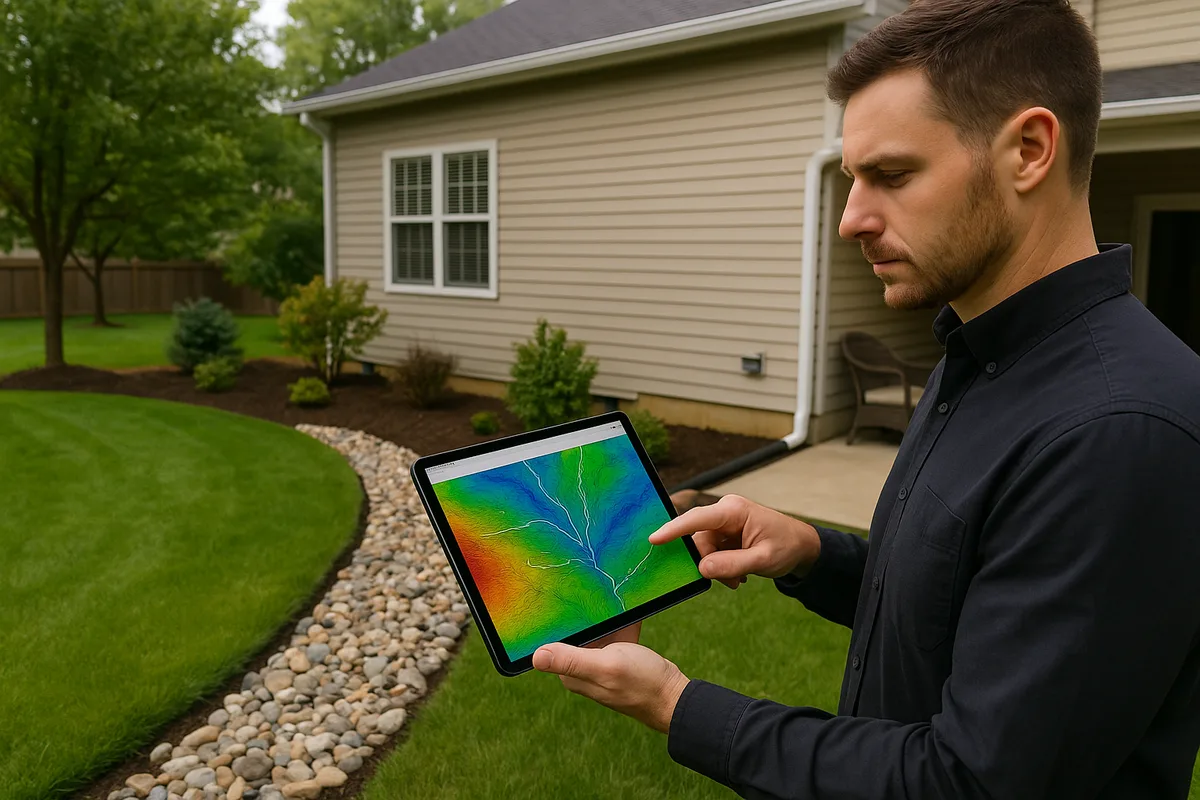
- Generate a slope map and flow direction analysis using free GIS software like QGIS. The "r.watershed" and "r.slope.aspect" tools can produce a complete drainage flow map in minutes.
- Identify the primary low points, flow paths, and contributing drainage areas before you visit the site.
- Create a preliminary site sketch with annotated elevations, slopes, and suspected problem areas.
This desktop analysis, which takes 20 to 30 minutes once you've practiced the workflow, replaces 60 to 90 minutes of on-site measurement. You arrive at the property already knowing where water flows, where it collects, and where the critical slopes are. Your field visit becomes a verification exercise rather than a discovery exercise.
Aerial Imagery and Historical Comparison
Google Earth's historical imagery feature (free) lets you scroll back through years of aerial photos. This is invaluable for identifying drainage changes over time — new impervious surfaces, removed trees, regraded areas, or added structures that may have altered flow patterns. Spending 5 minutes reviewing historical aerials can reveal the cause of a drainage problem that would otherwise take 30 minutes of on-site investigation to hypothesize.
County GIS portals often provide additional layers: stormwater infrastructure maps, soil types, floodplain boundaries, and easement locations. Pulling this information before the site visit means you're not guessing about what's underground or what regulatory constraints might affect your solution design.
Phase 2: Streamlined Field Verification with Mobile Tools
The pre-visit analysis doesn't eliminate the field visit — it transforms it. Instead of spending 90 to 120 minutes on-site taking measurements from scratch, you're spending 30 to 45 minutes verifying your desktop findings, documenting conditions, and capturing the details that remote data can't provide.
What to Verify vs. What to Skip
Your desktop analysis already gave you the macro picture: overall lot slope, primary flow directions, and approximate elevations. On-site, you need to verify and supplement:
- Foundation-to-grade relationships: LiDAR can't see through vegetation or mulch beds. You need to physically measure the grade at the foundation wall and confirm whether the minimum 6-inch drop over the first 10 feet (per IRC/IBC standards) is being met.
- Gutter and downspout discharge locations: Where does roof runoff actually go? Desktop data won't show you a disconnected downspout dumping water against the foundation.
- Soil conditions: A quick hand-auger test or visual assessment of soil type confirms what the NRCS Web Soil Survey suggested and tells you about infiltration capacity.
- Existing drainage infrastructure: Note the location and condition of French drains, catch basins, channel drains, swales, and any municipal stormwater connections.
- Vegetation and ground cover: Turf, bare soil, mulch, and hardscape all affect runoff coefficients. A quick visual inventory is faster than trying to interpret this from aerial imagery.
- Visible water damage indicators: Staining on foundation walls, erosion channels, sediment deposits, and standing water evidence.
What you can skip or minimize: taking dozens of elevation shots across the yard (your DEM already has this), pacing off lot dimensions (you have the parcel data), and sketching the lot layout from scratch (you brought a pre-made base map).
Mobile Data Collection
Replace the clipboard-and-pencil approach with a mobile data collection system. This can be as simple as a structured note-taking template on your phone or as sophisticated as a mobile GIS app. The key principles:
- Photograph everything systematically: Take photos at each corner of the house, each downspout, each visible drainage feature, and each problem area. Use a photo app that geotags automatically.
- Use a standardized checklist: A consistent field form ensures you never forget to check a critical item and makes office processing faster because the data is always in the same format.
- Record voice notes: Narrating observations as you walk the property is 3 to 4 times faster than writing them down and captures nuance that checkboxes miss.
- Mark up your pre-made base map: Using a tablet or printed aerial with your pre-identified features, annotate directly on the map. Circle confirmed low points, draw arrows for observed flow paths, and note discrepancies from your desktop analysis.
This systematic approach to field verification typically takes 30 to 45 minutes for a standard residential lot (quarter-acre to half-acre). Compare that to the 90 to 120 minutes of a traditional full-site survey, and you've already saved an hour.
Phase 3: Automated Drainage Calculations and Sizing
The calculations involved in drainage estimating — runoff volumes, pipe sizing, trench dimensions, gravel quantities, and slope requirements — are repetitive and formulaic. They're perfect candidates for automation.
The Rational Method and Spreadsheet Automation
Most residential drainage design relies on the Rational Method (Q = CiA) for estimating peak runoff flow rates, where Q is the flow rate, C is the runoff coefficient, i is the rainfall intensity, and A is the drainage area. For any given region, the rainfall intensity comes from published IDF (Intensity-Duration-Frequency) curves — data available through NOAA Atlas 14.
Build (or buy) a spreadsheet that automates these calculations:
- Input the drainage area (measured from your desktop analysis in square feet or acres).
- Select the surface type from a dropdown (lawn, gravel, concrete, roof) to auto-populate the runoff coefficient.
- Enter the design storm (typically 10-year, 24-hour for residential, though local codes vary).
- Auto-calculate the peak flow rate using the Rational Method.
- Auto-size the drainage pipe using Manning's equation, with built-in lookup tables for common pipe materials and slopes.
- Auto-calculate trench dimensions and material quantities: linear feet of pipe, cubic yards of gravel, square yards of filter fabric, number of catch basins.
A well-built spreadsheet performs in 30 seconds what takes 15 to 20 minutes by hand. More importantly, it eliminates arithmetic errors that can lead to undersized systems or inflated material estimates.
Template-Based Solution Design
Most residential drainage problems fall into a manageable number of categories:
- Foundation grading deficiency: Soil needs to be regraded to achieve proper slope away from the house.
- Downspout management: Roof runoff needs to be captured and redirected via underground extensions or pop-up emitters.
- French drain installation: Subsurface water interception along a foundation wall, property line, or low area.
- Surface drainage (swale or channel drain): Redirecting sheet flow across hardscape or turf.
- Catch basin and pipe network: Collecting water from multiple sources and conveying it to a discharge point.
- Dry well or infiltration system: On-site stormwater disposal where no gravity outlet exists.
For each category, create a standardized solution template that includes typical specifications, material lists, labor estimates, and unit costs. When you encounter a foundation grading issue on-site, you don't design from scratch — you pull the template, adjust the quantities based on the specific site dimensions, and the estimate practically builds itself.
This template approach works because residential drainage is fundamentally repetitive. Yes, every site is different, but the solutions draw from the same toolkit. A French drain along a 60-foot foundation wall uses the same materials and methods as one along a 40-foot wall — you just adjust the quantities.
Phase 4: Systematizing the Estimate Delivery
The final phase — assembling and delivering the estimate — is where many professionals lose unnecessary time. They rewrite scope descriptions from scratch, manually format documents, and spend too long on presentation. Systematizing this phase can save 30 to 60 minutes per estimate.
Building a Modular Estimate Template
Create a master estimate document with modular sections that can be mixed, matched, and customized:
- Header block: Company info, client name, property address, date, estimate number (auto-generated).
- Site conditions summary: A templated paragraph describing the property's drainage situation, with fill-in-the-blank fields for specific details. Example: "The property at [ADDRESS] exhibits [PROBLEM TYPE] affecting approximately [AREA] square feet of the [LOCATION]. Current grade slopes at [X]% toward [DIRECTION], which is [insufficient/reversed] relative to the recommended minimum of 2% away from the foundation."
- Scope of work modules: Pre-written scope descriptions for each solution type. A French drain module might read: "Install [LENGTH] linear feet of 4-inch perforated HDPE pipe in a [WIDTH]-inch by [DEPTH]-inch gravel-filled trench, wrapped in non-woven geotextile filter fabric, with [NUMBER] cleanout access points. Trench to be installed at a minimum slope of 1% toward [DISCHARGE POINT]."
- Material and labor line items: Pulled from your calculation spreadsheet, with unit costs that update when you adjust your pricing.
- Terms, warranty, and exclusions: Standard boilerplate that rarely changes.
- Diagrams and photos: Insert your annotated site map and key field photos directly into the estimate.
With modular templates, assembling an estimate becomes an exercise in selection and customization rather than creation. A typical residential drainage estimate can be assembled in 15 to 20 minutes instead of 45 to 60.
Same-Day or Next-Day Delivery
The speed advantage of this workflow enables same-day estimate delivery for straightforward projects. Here's what that timeline looks like:
- Morning: 20-minute desktop analysis before the site visit.
- Mid-morning: 35-minute field verification.
- Lunch / drive time: 10-minute calculation run in your spreadsheet.
- Early afternoon: 20-minute estimate assembly.
- Afternoon: Estimate delivered via email with a professional PDF.
Total active work time: approximately 85 minutes. Compare that to the traditional 4 to 8 hours. Even accounting for travel time and the learning curve of new tools, you're looking at a 60 to 70% reduction in total time per estimate.
This speed impresses homeowners. When a property owner requests three quotes and you deliver yours within 24 hours — complete with annotated aerial photos, a clear scope of work, and a professional format — while your competitors take 5 to 7 days, you've already won on professionalism before the price is even compared.
Phase 5: Building a Reusable Data Library
The efficiency gains described above are substantial on a per-job basis, but they compound over time as you build a reusable library of data, templates, and local knowledge.
Local Rainfall and Soil Data
Once you've looked up the design storm rainfall intensity for your service area using NOAA Atlas 14, save it. You'll use the same values for every estimate in that area. Similarly, once you've identified the dominant soil types in the neighborhoods you serve using the NRCS Web Soil Survey, create a quick-reference table with hydrologic soil groups, infiltration rates, and recommended design adjustments for each.
Over time, this local data library eliminates repetitive lookups. Instead of querying NOAA Atlas 14 for every estimate, you glance at your cheat sheet: "10-year, 1-hour intensity for our county: 2.8 inches per hour." Instead of running a soil survey for every lot, you know that the subdivision on Elm Street is all Group C clay and the neighborhood on Oak Avenue is Group A sandy loam.
Pricing Database
Maintain a living database of your actual costs — not just material prices, but real-world labor productivity rates. How many linear feet of French drain does your crew install per hour? How long does it take to regrade 500 square feet of foundation perimeter? How many cubic yards of gravel does a typical 80-foot French drain actually consume (not theoretically, but in practice, including waste and compaction)?
This database, updated after each completed job, makes your estimates increasingly accurate over time. Accurate estimates mean fewer change orders, better margins, and happier customers. They also mean faster estimating, because you're not second-guessing your numbers — you're pulling from verified historical data.
Photo and Condition Library
Build a categorized library of site photos showing common drainage conditions: proper grading, improper grading, failed French drains, erosion damage, standing water, effective swales, and so on. These photos serve double duty — they help you quickly identify and categorize conditions in the field (pattern recognition), and they can be included in estimates and reports to help homeowners understand their problems visually.
Common Pitfalls That Sabotage Efficiency
Even with a streamlined workflow, certain habits and mistakes can erode your time savings. Being aware of these pitfalls helps you maintain the 70% efficiency gain over the long term.
Over-Engineering Residential Solutions
Residential drainage is not civil engineering for a commercial parking lot. While accuracy matters, spending 45 minutes modeling a backyard drainage system in EPA SWMM when a simple Rational Method calculation and standard French drain specification would suffice is a misuse of time. Match your analysis depth to the project scope. A $3,000 downspout extension project doesn't need the same engineering rigor as a $30,000 whole-property regrading job.
Failing to Qualify Leads Before Site Visits
The fastest site assessment is the one you don't need to do. Before scheduling a visit, spend 5 minutes on the phone with the homeowner to understand the problem, confirm the property address (so you can do desktop analysis), and qualify the lead. Is the homeowner ready to invest in a solution, or are they just curious? Is the problem within your scope of services? Is the property accessible? A brief qualifying call prevents wasted trips to properties where you'll never close a deal.
Neglecting to Update Templates and Pricing
Templates and pricing databases are only valuable if they're current. Material costs fluctuate — the price of 4-inch corrugated HDPE pipe, washed gravel, and filter fabric can shift significantly year over year. Labor rates change as you hire, train, and adjust wages. If your templates reference outdated pricing, you'll either lose money on underbid jobs or lose jobs on overbid estimates. Schedule a quarterly review of all templates and pricing data.
Skipping the Desktop Analysis
Once you've experienced the power of pre-visit desktop analysis, it's tempting to skip it when you're busy or when a job seems straightforward. Don't. The 20 minutes you invest in desktop analysis saves 60 or more minutes in the field and produces a better result. Even for "simple" jobs, the desktop review often reveals complications — a hidden swale, an unexpected slope reversal, or a neighbor's property draining onto the subject lot — that you'd otherwise discover on-site and have to react to in real time.
Not Investing in Learning GIS Basics
The desktop analysis workflow described in Phase 1 requires basic familiarity with GIS software, particularly QGIS, which is free and open-source. Many drainage professionals resist this learning curve because it feels outside their skill set. But the investment is modest — 10 to 15 hours of self-guided learning through YouTube tutorials and practice — and the payoff is enormous. You don't need to become a GIS expert. You need to learn three or four specific operations: loading a DEM, generating a slope map, running a flow direction analysis, and measuring areas. That's it.
Measuring Your Efficiency Gains
To confirm you're actually achieving the 70% time reduction, you need to track your numbers. This doesn't require sophisticated project management software — a simple spreadsheet will do.
For each estimate, record:
- Total time invested: Desktop analysis + travel + field visit + calculations + estimate assembly + delivery.
- Outcome: Won, lost, or pending.
- Actual vs. estimated quantities (post-completion): How close was your estimate to reality?
- Customer feedback: Did they comment on response time, professionalism, or clarity?
After 20 to 30 estimates using the new workflow, calculate your average time per estimate and compare it to your historical baseline. Most professionals who implement the full workflow described here report total active time of 75 to 120 minutes per estimate, down from 4 to 8 hours — a reduction of 60 to 75%.
Track your close rate, too. Many contractors find that faster, more professional estimates improve their close rate by 10 to 20 percentage points. The combination of time savings and improved close rates can effectively double your revenue capacity without adding staff.
Putting It All Together: A Real-World Example
Let's walk through a concrete example to illustrate the complete workflow.
The call: A homeowner on Maple Drive reports water pooling against their foundation after heavy rain. They want a quote for a solution.
Desktop analysis (20 minutes): You pull the property address, download the DEM tile from USGS, and run a quick slope and flow analysis in QGIS. The data reveals that the backyard slopes toward the house at approximately 1.5% — a negative grade. The contributing drainage area is roughly 4,200 square feet. You also check the NRCS Web Soil Survey and confirm the soil is hydrologic Group C (slow infiltration, high runoff potential). You pull up the county GIS portal and note that the nearest stormwater inlet is 120 feet away at the street. Historical aerial imagery shows that a patio was added 3 years ago, which likely altered the original grading. You print an annotated aerial map.
Field visit (35 minutes): You arrive with your annotated map and checklist. You confirm the negative grade at the foundation (your laser level shows -1.3% toward the house over 15 feet — consistent with the DEM data). You note that two downspouts discharge directly at the foundation with no extensions. The soil is dense clay, confirming the Group C classification. You photograph the water staining on the foundation wall (18 inches high), the ponding area, the patio edge where water is being redirected, and each downspout. You check for existing drainage infrastructure — there is none. You note the discharge path to the street stormwater inlet and confirm it's viable with adequate fall.
Calculations (10 minutes): Back in your truck, you open your spreadsheet. You enter the 4,200 SF drainage area, select "lawn/clay" for the runoff coefficient (C = 0.35), and enter your local 10-year, 1-hour rainfall intensity (2.8 in/hr). The spreadsheet calculates a peak flow of 0.094 CFS. It sizes a 4-inch pipe (more than adequate) and calculates the French drain dimensions: 80 linear feet of trench, 12 inches wide by 18 inches deep, requiring 4.4 cubic yards of washed gravel, 80 feet of perforated pipe, and 160 square feet of filter fabric. It also calculates the two downspout extensions at 25 feet each. Material quantities and costs auto-populate.
Estimate assembly (20 minutes): You open your estimate template, fill in the client details, select the "French Drain" and "Downspout Extension" scope modules, paste in the calculated quantities, insert your annotated aerial and three key field photos, and review the total. The estimate includes a clear problem description, a detailed scope of work, an itemized price, and your standard terms. You export to PDF.
Delivery: You email the estimate at 2:15 PM — less than 4 hours after the homeowner's initial call. Total active work time: approximately 85 minutes.
The homeowner receives a professional, photo-documented estimate with an aerial site map before any other contractor has even scheduled a visit. You've demonstrated expertise, responsiveness, and thoroughness. The job is yours to lose.
Start Cutting Your Assessment Time Today
The 70% time reduction in site assessment and drainage estimating isn't theoretical — it's the practical result of replacing outdated manual workflows with a systematic, data-driven approach. The tools are available, most of them free. The techniques are learnable in days, not months. And the payoff — in time saved, jobs won, and estimates improved — begins with your very next property.
Start with the highest-impact change: pre-visit desktop analysis using publicly available elevation data. Master that single step, and you'll immediately feel the difference. Then layer in the field verification checklist, the calculation spreadsheet, and the modular estimate templates. Within a month, you'll wonder how you ever operated without them.
At Low Point Labs, we specialize in topographic drainage intelligence — turning raw elevation data into actionable insights about how water moves across residential properties. Our drainage assessment tools and reports are designed to give contractors, inspectors, and homeowners the precise topographic information they need to identify problems and design solutions faster than ever before. If you're ready to transform your site assessment workflow, explore how Low Point Labs can provide the drainage intelligence foundation that makes everything else faster.
Get Your Drainage Intelligence Report™
Start a free trial and generate reports on demand.
Frequently Asked Questions
Using modern workflows with pre-visit desktop analysis and structured field verification, a residential drainage site assessment should take 75 to 120 minutes of active work time. Traditional manual methods typically require 4 to 8 hours for the same scope of work.
QGIS (free GIS software) for terrain analysis, USGS 3DEP for high-resolution elevation data, NRCS Web Soil Survey for soil classification, NOAA Atlas 14 for local rainfall data, and Google Earth for aerial imagery and historical comparison. Combined, these free tools can replace thousands of dollars in survey equipment for preliminary analysis.
USGS 3DEP LiDAR data is typically accurate to within 10-20 centimeters vertically at 1-meter horizontal resolution. This is sufficient for identifying slopes, flow directions, and low points on residential lots. However, field verification of critical measurements — especially foundation-to-grade relationships — is still essential.
Most residential drainage estimates require the Rational Method (Q = CiA) for peak runoff calculation, Manning's equation for pipe sizing, and basic volume calculations for trench dimensions and material quantities. These calculations can be automated in a spreadsheet to produce results in under a minute.
Deliver estimates within 24 to 48 hours, include annotated aerial photos and site maps, provide clear scope descriptions with specific measurements, and present a professional formatted document. Contractors who implement these practices typically see close rate improvements of 10 to 20 percentage points.
Using publicly available elevation data for preliminary drainage assessment and estimating does not typically require a surveyor's license. However, if your jurisdiction requires stamped grading plans or engineered drainage designs for permitting, those documents must be prepared by a licensed professional engineer or surveyor.
Related Articles
The Automated Watershed Map: The Tool Drainage Contractors Didn't Know They Needed
How to Calculate a Catchment Area Without Spending Hours on Google Earth