How to Calculate a Catchment Area Without Spending Hours on Google Earth
Every drop of rain that lands on your roof, driveway, or yard has to go somewhere. Understanding exactly where that water comes from — and where it goes — starts with one fundamental concept: the catchment area. Whether you're troubleshooting a flooded basement, sizing a rain garden, or designing a French drain system, knowing the precise boundaries of your catchment area is the single most important step in any drainage project.
For years, the default approach has been to fire up Google Earth, squint at satellite imagery, and try to manually trace ridgelines and flow paths. While Google Earth is a remarkable tool for general visualization, using it to delineate catchment boundaries is tedious, imprecise, and often frustrating — especially for residential properties where elevation changes are subtle. The good news? There are faster, more accurate methods available today that can cut your analysis time from hours to minutes. In this guide, we'll walk through exactly how to calculate a catchment area efficiently, what tools actually deliver the accuracy you need, and when Google Earth is (and isn't) the right tool for the job.
What Is a Catchment Area and Why Does It Matter?
A catchment area — also called a drainage area, watershed, or drainage basin — is the total land surface that contributes runoff to a single point. Think of it as the topographic "funnel" that channels all precipitation toward a specific outlet, whether that's a storm drain inlet, a creek crossing, a low point in your yard, or your foundation wall. Every square foot of land within that boundary is a potential contributor to the volume of water arriving at that outlet during a rain event.
For residential properties, catchment area calculations are critical for several reasons. First, they determine the total volume of stormwater you need to manage. A property that only receives runoff from its own lot has a fundamentally different drainage challenge than one that collects water from an uphill neighbor's yard, a nearby road, or an adjacent hillside. Second, catchment area is the primary input for sizing drainage infrastructure — gutters, downspout systems, French drains, dry wells, swales, and retention basins are all designed based on the peak flow rate, which is directly proportional to the contributing catchment area.
Third, and perhaps most importantly, misidentifying your catchment area leads to undersized or misplaced drainage solutions. If you calculate your catchment at 2,000 square feet when it's actually 8,000 square feet because you missed an uphill contributing area, your French drain will be overwhelmed during moderate storms. This is one of the most common — and most expensive — mistakes in residential drainage design.
The Anatomy of a Catchment Boundary
Catchment boundaries follow ridgelines — the high points of terrain that divide water flowing in one direction from water flowing in another. In mountainous terrain, these ridgelines are obvious. In suburban landscapes, they're often subtle: a barely perceptible crown in a road, a slight rise between two backyards, or the peak of a shared property berm. The boundary is perpendicular to contour lines at every point, always running along the highest ground between two adjacent drainage paths.
The outlet point — sometimes called the pour point — is where you're measuring. For a homeowner, this might be the corner of your foundation where water pools, the inlet to your yard drain, or the low spot in your backyard where standing water collects after every storm. The catchment area is everything uphill of that point that drains toward it.
Why Google Earth Falls Short for Catchment Delineation
Let's be clear: Google Earth is an incredible tool. Its satellite imagery is detailed, its interface is intuitive, and it's free. For getting a bird's-eye view of your property and its surroundings, it's hard to beat. But when it comes to actually delineating catchment boundaries and calculating drainage areas, Google Earth has significant limitations that can lead to inaccurate results and wasted time.
The fundamental problem is that Google Earth is primarily an imagery platform, not a topographic analysis tool. While it does include elevation data (derived from the Shuttle Radar Topography Mission and other sources), that data has a resolution of roughly 30 meters — meaning each elevation pixel covers a 30-by-30-meter area. For large-scale watershed analysis, that's adequate. For a residential lot where the difference between water flowing toward your house or away from it might be a 6-inch elevation change over 20 feet, 30-meter resolution is essentially useless.
The typical Google Earth workflow for catchment delineation looks something like this: zoom in on your property, use the elevation profile tool to draw cross-sections, try to identify high points and ridgelines, manually trace a polygon around what you think the catchment boundary is, and then use the polygon measurement tool to get an area. This process is inherently subjective. You're making visual judgments about where ridgelines fall based on coarse elevation data and satellite imagery that shows vegetation, buildings, and shadows — none of which reliably indicate drainage divides.
The Time Problem
Beyond accuracy, there's the sheer time investment. Manually tracing a catchment boundary in Google Earth for even a simple residential scenario typically takes 30 to 90 minutes. If you're iterating — trying different pour points, checking multiple drainage paths, or analyzing a complex site — you can easily spend an entire afternoon. For professionals doing this regularly, that time cost is unsustainable. For homeowners doing it once, the learning curve of trying to interpret elevation profiles and contour patterns makes the process even longer.
The irony is that automated tools can perform the same analysis in seconds using higher-resolution data. The technology exists to delineate catchments with sub-meter accuracy from LiDAR-derived elevation models — the question is just knowing where to find these tools and how to use them.
Better Data Sources: Moving Beyond Satellite-Derived Elevation
The single biggest upgrade you can make to your catchment analysis is using better elevation data. The USGS 3D Elevation Program (3DEP) has been systematically collecting high-resolution LiDAR data across the United States, and as of 2026, coverage extends to the vast majority of the continental U.S. This data offers elevation resolution of 1 meter or better — a 30x improvement over what Google Earth provides.
LiDAR (Light Detection and Ranging) works by firing laser pulses from aircraft and measuring how long they take to bounce back. The result is a dense cloud of elevation points that captures subtle terrain features: the crown of a driveway, the lip of a curb, the gentle slope of a backyard. When processed into a Digital Elevation Model (DEM), this data reveals drainage patterns that are completely invisible in satellite imagery or coarse elevation datasets.
For residential drainage analysis, LiDAR-derived DEMs are transformative. They can distinguish a 0.5% slope from a 2% slope across your yard. They can identify micro-ridgelines between properties that determine whether your neighbor's runoff flows toward your foundation or toward the street. They can reveal subtle depressions and low points where water accumulates — features that are often the root cause of drainage complaints but are invisible from the surface.
Where to Access LiDAR Data
The most straightforward access point for LiDAR-derived elevation data is the USGS National Map Viewer, where you can browse available datasets and download DEMs for your area. The data is free and publicly available. However, raw DEM files require GIS software to process — they're not something you can simply open and interpret visually.
For those comfortable with GIS, QGIS is a free, open-source platform that can ingest DEM data and perform watershed delineation using built-in hydrology tools. The learning curve is real — expect to invest several hours learning the interface if you're new to GIS — but the results are dramatically more accurate than anything you can achieve manually in Google Earth.
For those who want high-resolution terrain data without the GIS learning curve, OpenTopography provides a more user-friendly interface for accessing and visualizing LiDAR datasets, including some on-demand processing capabilities.
Step-by-Step: Calculating a Catchment Area Efficiently
Regardless of the tool you use, the process of delineating a catchment area follows the same logical steps. Understanding this workflow will help you work faster and catch errors, whether you're using professional software or a simplified online tool.
Step 1: Define Your Pour Point
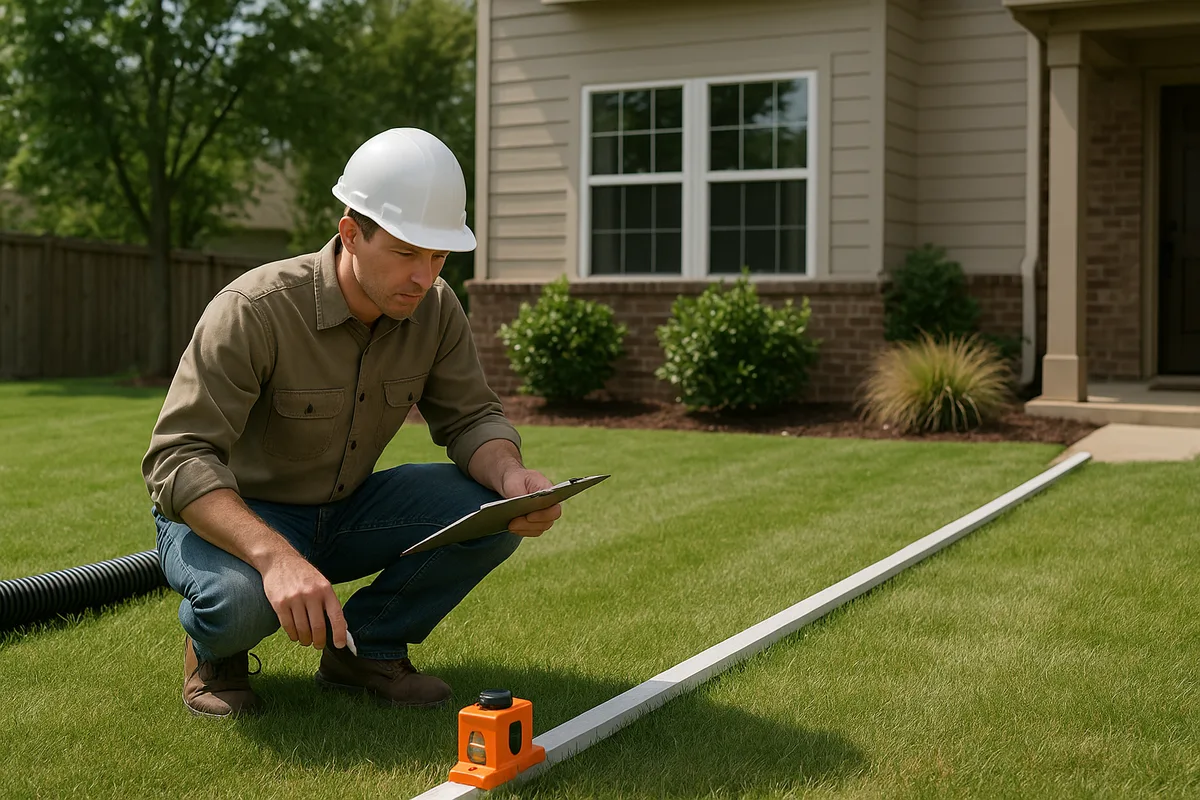
Before you touch any software, walk your property and identify the specific point where you want to calculate the contributing drainage area. This should be a precise location: the inlet of a catch basin, the corner of your foundation where water pools, the low point in your swale, or the spot where your yard drain collects water. Mark it with a stake or GPS pin. The more precisely you define this point, the more accurate your catchment delineation will be.
If you're designing a new drainage system, you may need to analyze multiple pour points — for example, each proposed drain inlet location — and compare the contributing areas to size each component appropriately.
Step 2: Obtain Elevation Data
For a quick residential analysis, you need a DEM that covers your property and the surrounding area. A good rule of thumb is to obtain data covering at least 500 feet beyond your property boundaries in every direction — further if you're on a hillside or in an area with long, gentle slopes. Water doesn't respect property lines, and your catchment area may extend well beyond your lot.
Download the highest-resolution DEM available for your area. In most of the U.S., this will be 1-meter LiDAR data from the 3DEP program. In areas without LiDAR coverage, you may need to fall back to 10-meter or 30-meter DEMs, but be aware that the accuracy of your catchment boundary will decrease proportionally.
Step 3: Condition the DEM
Raw elevation data contains "sinks" — small depressions that are either real features (like ponds) or artifacts of the data collection process. Before you can delineate flow paths and catchments, you need to "fill" these sinks so that the algorithm can trace continuous flow paths from every cell to the pour point. In GIS software, this is typically a one-click operation called "Fill Sinks" or "Fill Depressions."
This step is critical. Unfilled sinks will cause the flow algorithm to get "stuck," producing incomplete or fragmented catchment boundaries. It's also worth noting that in urban and suburban environments, some sinks are real — a depressed patio, a sunken garden bed — and filling them may alter the analysis. Professional analysts review filled areas to ensure important features aren't being artificially modified.
Step 4: Calculate Flow Direction and Accumulation
With a conditioned DEM, the next step is to calculate flow direction — determining which direction water flows from each cell based on the elevation of its neighbors. The most common algorithm (D8) assigns flow from each cell to the single steepest downhill neighbor. More advanced algorithms (D-infinity, multiple flow direction) distribute flow proportionally, which can be more realistic on gentle slopes.
Flow accumulation is then calculated by counting how many upstream cells flow into each cell. Cells with high flow accumulation values represent streams, channels, and concentrated flow paths. This grid is essentially a map of where water concentrates on your landscape — and it's often revelatory. Homeowners frequently discover that their "mysterious" wet spot in the yard corresponds to a natural flow accumulation path that's been there since long before the house was built.
Step 5: Delineate the Catchment
With flow direction calculated, you snap your pour point to the flow accumulation grid (ensuring it falls on an actual flow path rather than a random cell) and run the watershed delineation tool. The algorithm traces upstream from your pour point, following flow direction arrows in reverse, until it reaches ridgelines where flow diverges. The result is a polygon representing every cell that contributes runoff to your pour point — your catchment area.
The area of this polygon, measured in square feet or acres, is your catchment area. In GIS software, this is a simple attribute calculation. For residential properties, catchment areas typically range from a few thousand square feet (a single lot draining to one point) to several acres (a hillside neighborhood contributing to a low-lying property).
Step 6: Validate with Field Observations
No digital analysis should be accepted without field validation. Walk the boundaries of your delineated catchment and check whether the ridgelines make sense on the ground. Look for features that the DEM might not capture: retaining walls, raised garden beds, berms, curbs, and subsurface drainage pipes can all redirect flow in ways that don't show up in elevation data. In developed areas, impervious surfaces like driveways and sidewalks often channel water along paths that differ from what natural topography would suggest.
Adjust your catchment boundary based on field observations. This hybrid approach — digital delineation refined by ground-truthing — produces the most reliable results.
Tools That Do the Heavy Lifting for You
If the GIS workflow described above sounds intimidating, you're not alone. The good news is that a growing ecosystem of tools can automate much of this process, ranging from free web applications to professional-grade platforms.
Web-Based Watershed Tools
Several online platforms allow you to delineate catchment areas by simply clicking on a map. The USGS StreamStats application, for example, lets you click on any point along a stream in the U.S. and instantly generates the upstream watershed boundary, along with basin statistics like area, slope, and land cover. While StreamStats is designed for stream-scale analysis (not individual yard drains), it's excellent for understanding the larger watershed context of your property.
For smaller-scale analysis, some state and county GIS portals offer drainage area tools built on local LiDAR data. These vary widely in availability and quality, but they're worth searching for — a query like "[your county] stormwater GIS" or "[your county] drainage map" will often turn up useful resources.
Mobile and Desktop Applications
Several commercial applications now offer catchment delineation as a feature, often bundled with other site analysis capabilities. These tools typically use cloud-hosted elevation data so you don't need to download and process DEMs yourself. You define your pour point, the application pulls the relevant elevation data, runs the hydrologic analysis on a server, and returns the catchment boundary and area — often in under a minute.
For professionals who perform this analysis regularly, the time savings are enormous. What used to require a GIS specialist and several hours of processing can now be accomplished on a tablet in the field.
When Google Earth Is Still Useful
Despite its limitations for catchment delineation, Google Earth retains real value in the drainage analysis workflow. Its high-resolution imagery is invaluable for identifying land cover types within your catchment — impervious surfaces like roofs and pavement versus pervious surfaces like lawns and gardens. This information is essential for calculating runoff coefficients, which determine what fraction of rainfall actually becomes runoff.
Google Earth's historical imagery feature is also powerful for understanding how your site has changed over time. Comparing images from different years can reveal when grading was altered, when impervious surfaces were added, or when vegetation was removed — all changes that affect drainage patterns. And its 3D terrain view, while not precise enough for catchment delineation, is excellent for communicating drainage concepts to clients, contractors, or neighbors.
From Catchment Area to Actionable Drainage Design
Knowing your catchment area is essential, but it's only the first input in a complete drainage analysis. To translate that number into a practical drainage design, you need to combine it with several other factors.
Calculating Peak Runoff
The Rational Method is the standard approach for estimating peak runoff from small catchment areas (under about 200 acres, which covers virtually all residential scenarios). The formula is elegantly simple:
Q = C × i × A
Where:
- Q = peak runoff rate (cubic feet per second)
- C = runoff coefficient (dimensionless, ranging from 0.1 for flat, sandy, vegetated areas to 0.95 for impervious surfaces)
- i = rainfall intensity (inches per hour, for your chosen design storm)
- A = catchment area (acres)
The catchment area (A) is what you've just calculated. The runoff coefficient (C) depends on the land cover within your catchment — this is where Google Earth imagery becomes useful for classifying surfaces. The rainfall intensity (i) comes from local precipitation data; NOAA Atlas 14 provides precipitation frequency estimates for any location in the U.S., allowing you to select the appropriate design storm (e.g., the 10-year, 24-hour storm).
For example, consider a residential property with a catchment area of 0.25 acres (about 10,900 square feet), a weighted runoff coefficient of 0.45 (mix of roof, driveway, and lawn), and a 10-year rainfall intensity of 4 inches per hour. The peak runoff would be:
Q = 0.45 × 4 × 0.25 = 0.45 cfs (cubic feet per second)
That's approximately 202 gallons per minute — a significant flow that requires properly sized drainage infrastructure to manage.
Sizing Drainage Infrastructure
With peak runoff calculated, you can size pipes, channels, and storage features. A 4-inch diameter pipe at 1% slope can carry about 0.10 cfs. A 6-inch pipe at the same slope handles about 0.30 cfs. For our example above (0.45 cfs), you'd need at least an 8-inch pipe or multiple smaller pipes to handle peak flow without surcharging.
This is why catchment area accuracy matters so much. If you underestimate your catchment area by 50%, you'll undersize your pipe by roughly one diameter class — and that pipe will back up and overflow during exactly the storms you designed it to handle.
Accounting for Impervious Surface Changes
One of the most common drivers of residential drainage problems is the incremental addition of impervious surfaces within a catchment area. A new patio here, a driveway extension there, a pool deck, a detached garage — each addition increases the runoff coefficient and the peak flow arriving at your low point. A catchment that functioned perfectly when it was 70% lawn may flood regularly after renovations push impervious coverage to 50%.
This is another reason why understanding your full catchment area is so valuable. It allows you to model "what-if" scenarios: What happens to peak flow if your uphill neighbor adds a 1,000-square-foot patio? What if you convert your lawn to artificial turf (which, despite appearances, is often less permeable than natural grass)? What if a new development uphill adds 2 acres of rooftops and parking to your catchment?
Common Mistakes in Catchment Area Calculation
Even with good tools and data, several common errors can lead to inaccurate catchment area calculations. Being aware of these pitfalls will help you avoid them.
Ignoring Off-Site Contributing Areas
The most frequent mistake homeowners make is assuming their catchment area equals their lot area. In reality, your catchment may include portions of neighboring properties, adjacent roads, or uphill open space. If your lot sits at the bottom of a gentle slope, your catchment area could be five to ten times larger than your lot. Always analyze the terrain beyond your property boundaries.
Overlooking Constructed Features
Retaining walls, curbs, swales, berms, and underground pipes all modify natural drainage patterns. A retaining wall can redirect an entire hillside's runoff from one catchment to another. A curb along a road can channel water hundreds of feet before releasing it at a single point. These features often don't appear in DEM data (especially at coarser resolutions) and must be accounted for through field observation.
Using Inappropriate Data Resolution
As discussed earlier, using 30-meter elevation data (the resolution available in Google Earth) for a residential catchment analysis is like using a yardstick to measure millimeters. The subtle terrain features that control residential drainage — a 1% slope across a yard, a shallow swale between properties — simply don't register at that resolution. Always use the highest-resolution data available, ideally 1-meter or better LiDAR-derived DEMs.
Confusing Surface and Subsurface Catchments
In some geological settings, the surface catchment (where water flows overland) differs from the subsurface catchment (where groundwater flows underground). This is particularly relevant in karst terrain, areas with fractured bedrock, or properties with extensive subsurface drainage systems. For most residential drainage analyses, the surface catchment is what matters — but if you're dealing with a high water table or spring-fed seepage, you may need to consider subsurface hydrology as well.
Not Validating Results in the Field
Digital analysis is a starting point, not an endpoint. Every catchment delineation should be validated by walking the site, observing drainage patterns during rain events, and checking for constructed features that modify flow. The best analysts combine digital precision with boots-on-the-ground observation.
Putting It All Together: A Practical Workflow
Here's a streamlined workflow that balances accuracy with efficiency — no hours-long Google Earth sessions required.
Define your problem. What specific drainage issue are you trying to solve? Where is the water accumulating? Mark your pour point(s).
Gather high-resolution elevation data. Download 1-meter LiDAR DEMs from the USGS 3DEP program or your state's GIS portal. If LiDAR isn't available, use the best resolution DEM you can find.
Run automated catchment delineation. Use GIS software (QGIS is free), a web-based watershed tool, or a commercial application to delineate the catchment boundary from your pour point.
Use Google Earth for land cover analysis. Switch to Google Earth to classify the surfaces within your catchment — rooftops, pavement, lawn, garden, wooded areas. Calculate a weighted runoff coefficient.
Field-validate your results. Walk the catchment boundary. Look for walls, curbs, pipes, and grading features that might alter the digital result. Adjust your boundary as needed.
Calculate peak runoff. Apply the Rational Method using your validated catchment area, runoff coefficient, and local rainfall intensity data.
Size your solution. Use the peak runoff value to size drainage infrastructure — pipes, channels, storage features — with appropriate safety factors.
This workflow typically takes 30 to 60 minutes for a straightforward residential site, compared to several hours of manual Google Earth analysis — and produces a significantly more accurate result.
The complexity of catchment analysis is precisely why professional drainage assessments exist. While the DIY approach outlined above works well for simple sites, properties with complex terrain, multiple contributing areas, or significant constructed features benefit enormously from expert analysis. At Low Point Labs, our topographic drainage intelligence platform leverages high-resolution elevation data and advanced hydrologic modeling to deliver precise catchment delineation, runoff calculations, and actionable drainage recommendations — without requiring you to become a GIS expert. If you're dealing with drainage issues on your property, explore how our assessment services can give you the clarity you need to solve the problem right the first time.
See Drainage Intelligence in Practice
Talk with our team or request an invitation to the platform.
Frequently Asked Questions
A catchment area is the total land surface that collects and channels rainwater to a single point, like a drain, creek, or low spot in your yard. Every drop of rain that falls within the catchment boundary eventually flows to that outlet point. It's essentially the 'funnel' that determines how much water arrives at any given location during a storm.
You can use Google Earth for a rough estimate, but its elevation data resolution (approximately 30 meters) is too coarse for accurate residential drainage analysis. Subtle grade changes that control yard drainage won't show up. Google Earth is better used for visualizing land cover and property context, while higher-resolution LiDAR data should be used for actual catchment delineation.
The USGS 3D Elevation Program (3DEP) provides free LiDAR-derived elevation data for most of the continental United States. You can access it through the USGS National Map Viewer or The National Map Download Client. Many state and county GIS portals also host locally collected LiDAR data that may be even higher resolution.
Usually not. Your catchment area includes all land that drains toward a specific point on your property, which may extend well beyond your property lines. If your lot sits downhill from neighboring properties, roads, or open space, your catchment area could be several times larger than your lot. This is one of the most common sources of drainage design errors.
QGIS is a free, open-source GIS platform that includes all the hydrology tools needed for catchment delineation. Commercial options like ArcGIS Pro offer additional features and support. Several web-based tools, including USGS StreamStats, can perform automated watershed delineation without any software installation, though they're designed for larger-scale analysis.
For sizing drainage infrastructure like pipes, French drains, and dry wells, your catchment area should be accurate within about 10-20%. Larger errors can result in undersized systems that fail during moderate storms or oversized systems that waste money. Using 1-meter LiDAR data combined with field validation typically achieves accuracy well within this range.
Related Articles
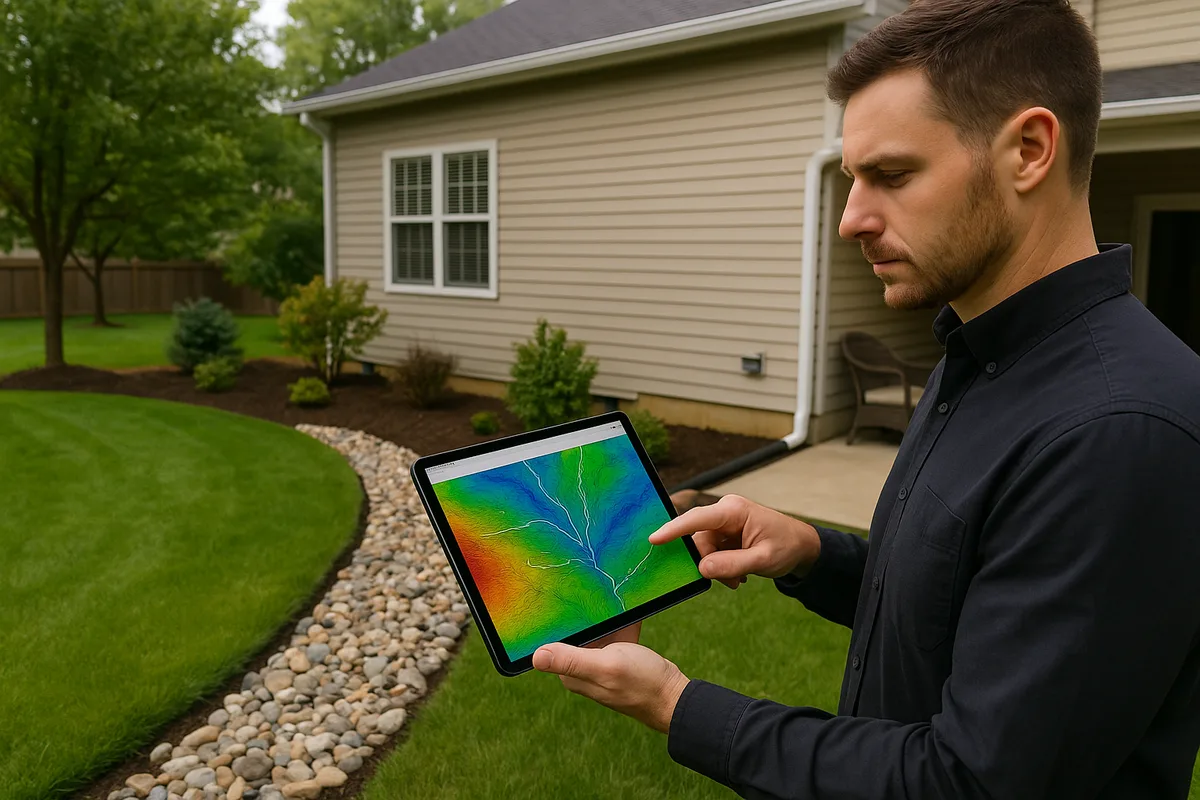
The Automated Watershed Map: The Tool Drainage Contractors Didn't Know They Needed
Drone Mapping vs. Cloud Topography: What's Faster for Landscape Grading?