Understanding Precipitation Intensity and Its Impact on Drainage Design
Every drainage system on your property — from the grading around your foundation to the storm drain at the curb — was designed (or should have been designed) around a single critical variable: rainfall intensity. Not total annual rainfall. Not average monthly precipitation. The rate at which rain falls during the most punishing minutes of a storm is what separates a dry basement from a flooded one.
Understanding how engineers and designers quantify rainfall intensity, translate it into design parameters, and size drainage infrastructure is essential knowledge for homeowners, contractors, and inspectors alike. Whether you're evaluating a new construction plan, troubleshooting a drainage failure, or simply trying to understand why your yard floods during certain storms but not others, the concepts of Intensity-Duration-Frequency (IDF) curves, design storms, and precipitation data analysis provide the answers. In this guide, we'll break down the science behind precipitation intensity and show you exactly how it shapes drainage design decisions for residential properties.
What Is Rainfall Intensity and Why Does It Matter?
Rainfall intensity is the rate at which precipitation falls over a given period, typically expressed in inches per hour (in/hr). A storm that delivers 2 inches of rain over 8 hours has a very different impact on your property than one that delivers 2 inches in 30 minutes. The first scenario produces a gentle, steady rain that soil can often absorb; the second produces a violent deluge that overwhelms gutters, saturates the ground surface almost instantly, and generates enormous volumes of runoff.
For drainage design purposes, peak rainfall intensity — the maximum rate of rainfall sustained over a specific short duration — is the governing metric. This is because drainage systems must handle the worst moments of a storm, not the average. A gutter system sized for average rainfall will fail catastrophically during peak intensity, which is precisely when you need it most. Peak intensities during severe thunderstorms in the eastern United States can exceed 6 inches per hour over 5-minute intervals, while the same region's average annual rainfall might translate to a benign 0.005 inches per hour if spread evenly.
The relationship between intensity and duration is inversely proportional: the shorter the duration you examine, the higher the intensity you'll observe. A storm might produce 4 inches per hour over a 15-minute window, but only 2.5 inches per hour when averaged over 60 minutes. This relationship is fundamental to drainage design because different components of a drainage system respond to different durations. A roof gutter responds to very short-duration intensities (5–10 minutes), while a neighborhood detention pond responds to longer-duration events (1–6 hours).
The Consequences of Ignoring Rainfall Intensity
When drainage systems are designed without proper consideration of rainfall intensity — or when they're designed using outdated or incorrect data — the results are predictable and costly. Undersized culverts back up and flood yards. Foundation drains overwhelm and allow hydrostatic pressure to build against basement walls. Swales overtop and erode landscaping. French drains saturate and cease functioning. Every one of these failures traces back to a mismatch between the system's capacity and the actual rainfall intensity it experiences.
This mismatch is becoming more common as climate patterns shift. Many existing drainage systems were designed using precipitation data from the mid-20th century. Updated analyses in numerous regions show that rainfall intensities for a given return period have increased by 10–30% compared to historical records. A system designed to handle a 10-year storm in 1980 may now be overwhelmed by what is effectively a 5-year storm today.
Get Your Drainage Intelligence Report™
Start a free trial and generate reports on demand.
IDF Curves: The Foundation of Drainage Engineering
Intensity-Duration-Frequency (IDF) curves are the single most important tool in drainage design. They are graphical or tabular representations that answer a deceptively simple question: For a storm of a given duration and frequency (return period), what rainfall intensity should we expect at this location?
An IDF curve plots rainfall intensity (y-axis) against storm duration (x-axis), with separate curves for different return periods (also called recurrence intervals). A typical IDF chart might show curves for the 2-year, 5-year, 10-year, 25-year, 50-year, and 100-year return periods. Reading the chart is straightforward: find your desired return period curve, move along it to your duration of interest, and read the corresponding intensity.
For example, an IDF curve for a location in the Mid-Atlantic might show that the 10-year, 30-minute rainfall intensity is 3.2 inches per hour. This means that, on average, a 30-minute rainfall event with an intensity of 3.2 in/hr or greater can be expected to occur once every 10 years. It does not mean it will happen exactly once per decade — it means there's a 10% probability of it occurring in any given year.
How IDF Curves Are Constructed
IDF curves are derived from decades of continuous rainfall records collected at weather stations. The process involves:
- Data collection: Gathering long-term (ideally 30+ years) records of rainfall from tipping-bucket rain gauges that record precipitation at fine time intervals (typically 5 or 15 minutes).
- Annual maximum extraction: For each year of record, identifying the maximum rainfall depth for each duration of interest (5 min, 10 min, 15 min, 30 min, 60 min, 2 hr, 6 hr, 12 hr, 24 hr).
- Frequency analysis: Fitting a probability distribution (commonly the Generalized Extreme Value or Log-Pearson Type III distribution) to each set of annual maxima to estimate rainfall depths for various return periods.
- Intensity conversion: Dividing each rainfall depth by its corresponding duration to obtain intensity values.
- Curve fitting: Plotting the results and fitting smooth curves through the data points.
The resulting curves are location-specific. An IDF curve for Houston, Texas looks dramatically different from one for Denver, Colorado or Seattle, Washington. Rainfall patterns are driven by regional climate, topography, proximity to moisture sources, and dominant storm types, making local data essential.
Reading and Using IDF Curves for Your Property
Homeowners and contractors don't need to construct IDF curves from scratch — they need to know how to access and interpret them. The key inputs you need to extract from an IDF curve for a drainage design are:
- Return period: What level of storm protection are you designing for? (More on this below.)
- Duration: What is the critical storm duration for your drainage component? This is typically set equal to the time of concentration — the time it takes water to travel from the most hydraulically remote point of your drainage area to the outlet.
- Intensity: The value read from the IDF curve at the intersection of your chosen return period and duration.
For a typical residential lot, the time of concentration might range from 5 to 20 minutes, depending on lot size, slope, and surface characteristics. This means residential drainage design is governed by short-duration, high-intensity rainfall — the most aggressive portion of the IDF curve.
NOAA Atlas 14: The Gold Standard for Precipitation Data
In the United States, the authoritative source for precipitation frequency estimates is NOAA Atlas 14, maintained by NOAA's Hydrometeorological Design Studies Center. Atlas 14 provides point precipitation frequency estimates for durations ranging from 5 minutes to 60 days and return periods from 1 year to 1,000 years, covering the vast majority of the continental United States.
Atlas 14 replaced earlier publications like Technical Paper 40 (TP-40, published in 1961) and HYDRO-35 (1977), which were based on significantly shorter and older data records. The differences between these legacy publications and Atlas 14 can be substantial. In some regions of the Southeast, Atlas 14 shows 10-year, 24-hour rainfall depths that are 15–25% higher than TP-40 values. If your property's drainage was designed using TP-40 data — which is likely for any development built before the 2000s — it may be significantly undersized by modern standards.
How to Access NOAA Precipitation Data for Your Location
Accessing NOAA rainfall data for your specific property is straightforward:
- Navigate to the NOAA Precipitation Frequency Data Server (PFDS).
- Select your state from the map or dropdown menu.
- Click on or enter coordinates for your property location.
- The system returns a comprehensive table of precipitation depth and intensity values for all standard durations and return periods.
- You can also generate IDF curves directly from the interface, download data tables, and view confidence intervals.
The output includes both precipitation depth (in inches) and intensity (in inches per hour) for every combination of duration and frequency. It also provides upper and lower 90% confidence bounds, which indicate the statistical uncertainty in the estimates. For critical applications — such as sizing drainage for a home in a flood-prone area — designing to the upper confidence bound provides an additional margin of safety.
Limitations and Emerging Updates
While Atlas 14 represents the best available precipitation data for most of the country, it has limitations. The underlying data records end at varying dates depending on the region, meaning the most recent years of precipitation data may not be reflected. Additionally, Atlas 14 is a stationary analysis — it assumes that the statistical properties of rainfall don't change over time. In a changing climate, this assumption is increasingly questioned.
Several states and research institutions have begun developing updated, non-stationary precipitation frequency analyses that account for observed trends in rainfall intensity. These studies generally show increases in extreme precipitation, particularly for short-duration, high-intensity events — exactly the type that governs residential drainage design. Homeowners and designers in regions with known increasing precipitation trends should consider applying a climate adjustment factor (typically 10–20%) to Atlas 14 values.
The Design Storm: Choosing Your Level of Protection
A design storm is a hypothetical rainfall event with a specific return period, duration, and temporal distribution that serves as the basis for sizing drainage infrastructure. Selecting the appropriate design storm is one of the most consequential decisions in drainage design, because it directly determines the capacity — and cost — of every component in the system.
Return Period Selection
The return period (or recurrence interval) defines the probability of exceedance. Common return periods used in residential drainage design include:
- 2-year storm: 50% probability of occurring in any given year. Used for minor drainage conveyances, roadside ditches, and basic lot grading. This is the minimum standard for routine residential drainage.
- 10-year storm: 10% annual probability. The most common design standard for residential storm sewer systems, culverts, and yard drainage infrastructure. Many municipal codes specify the 10-year storm as the minimum design standard.
- 25-year storm: 4% annual probability. Often required for drainage systems protecting higher-value structures or in areas with limited overflow capacity.
- 100-year storm: 1% annual probability. Used for floodplain delineation, major detention facilities, and emergency overflow paths. While individual homeowners rarely design to this standard, understanding the 100-year flood elevation is critical for properties in or near flood zones.
Choosing a higher return period means designing for a more intense storm, which requires larger pipes, deeper swales, bigger detention areas, and higher costs. But it also means fewer failures over the life of the system. A drainage system designed for the 2-year storm will be overwhelmed, on average, once every two years. A system designed for the 25-year storm will experience exceedance far less frequently.
Storm Duration and Temporal Distribution
Beyond return period, the design storm must specify a duration and a temporal pattern (how rainfall intensity varies over the course of the storm). For small residential sites, the critical storm duration is typically short — often 10 to 30 minutes — because that's the time of concentration for the drainage area. For these short durations, a uniform intensity (constant rate over the entire duration) is a reasonable and commonly used assumption.
For larger sites or more complex analyses, engineers use synthetic temporal distributions that model how a real storm unfolds over time. The most widely used distributions in the United States include:
- NRCS (SCS) Type I, IA, II, and III distributions: These 24-hour rainfall distributions were developed by the Natural Resources Conservation Service and vary by geographic region. Type II, used across most of the central and eastern United States, places the peak intensity near the middle of the storm, producing a pronounced spike that generates the highest runoff rates.
- Huff distributions: Developed from Illinois rainfall data, these distributions categorize storms by which quartile contains the peak intensity. First-quartile storms (peak early) tend to be the most critical for small watersheds.
- Balanced storm distributions: These synthetic hyetographs are constructed directly from IDF curve data and ensure that the design intensity is matched for every sub-duration within the storm.
For most residential drainage applications, the choice of temporal distribution is less critical than getting the return period and intensity correct. However, for properties with detention or retention requirements, the temporal pattern can significantly affect peak discharge calculations.
Calculating Runoff from Rainfall Intensity
Knowing the rainfall intensity is only half the equation. The other half is translating that intensity into a volumetric flow rate — the actual quantity of water per unit time that your drainage system must convey. The most common method for small residential sites is the Rational Method.
The Rational Method
The Rational Method estimates peak runoff flow rate using the formula:
Q = C × i × A
Where:
- Q = peak runoff flow rate (cubic feet per second, cfs)
- C = runoff coefficient (dimensionless, ranging from 0 to 1)
- i = rainfall intensity (inches per hour), obtained from IDF curves for the design return period and a duration equal to the time of concentration
- A = drainage area (acres)
The runoff coefficient (C) represents the fraction of rainfall that becomes surface runoff. It varies by surface type:
| Surface Type | Typical C Value |
|---|---|
| Asphalt/concrete | 0.85–0.95 |
| Rooftops | 0.85–0.95 |
| Gravel surfaces | 0.40–0.60 |
| Bare soil | 0.40–0.65 |
| Lawns (flat, sandy soil) | 0.05–0.10 |
| Lawns (steep, clay soil) | 0.25–0.35 |
| Wooded areas | 0.05–0.25 |
For a composite drainage area with multiple surface types, you calculate a weighted average C value based on the proportion of each surface type.
A Practical Example
Consider a residential lot in Charlotte, North Carolina with the following characteristics:
- Total drainage area: 0.25 acres
- Surface breakdown: 40% impervious (roof, driveway) with C = 0.90; 60% lawn on clay soil with C = 0.30
- Time of concentration: 15 minutes
- Design storm: 10-year return period
Step 1: Calculate the composite runoff coefficient. C = (0.40 × 0.90) + (0.60 × 0.30) = 0.36 + 0.18 = 0.54
Step 2: Look up the 10-year, 15-minute rainfall intensity from NOAA Atlas 14 for Charlotte. The value is approximately 5.4 inches per hour.
Step 3: Apply the Rational Method. Q = 0.54 × 5.4 × 0.25 = 0.73 cfs (cubic feet per second)
This means the drainage system at the outlet of this lot must be capable of conveying at least 0.73 cfs — approximately 328 gallons per minute — without backing up, overtopping, or causing erosion. This flow rate directly determines pipe sizes, swale dimensions, and inlet capacities.
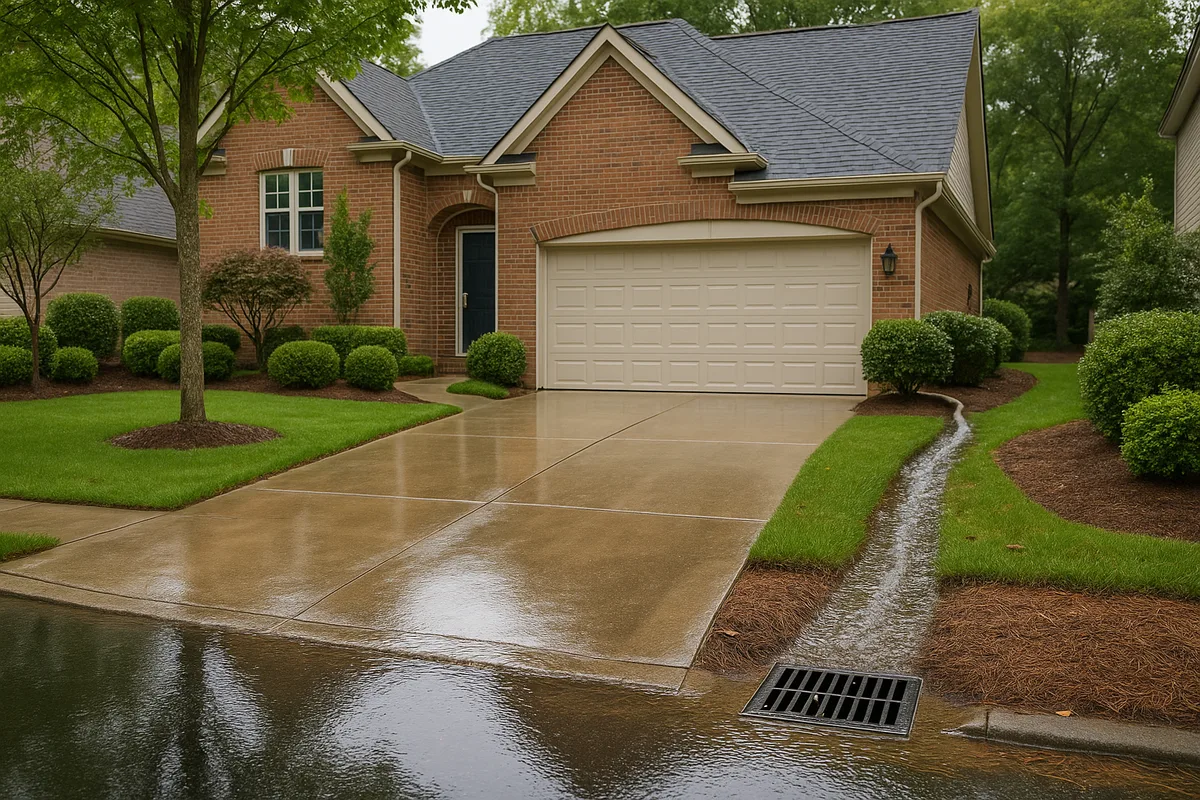
Why Impervious Surfaces Amplify the Problem
Notice how dramatically the runoff coefficient changes between natural and developed surfaces. A fully wooded lot might have a composite C of 0.15, while the same lot after development might jump to 0.54 or higher. This means development can triple or quadruple the peak runoff from a given rainfall intensity. This is precisely why municipalities require stormwater management plans for new development — and why homeowners who add impervious surfaces (patios, driveways, additions) without upgrading drainage are inviting problems.
Time of Concentration: The Critical Link
The time of concentration (Tc) is the time required for water to travel from the most hydraulically distant point in a drainage area to the outlet. It is the critical link between your drainage area's physical characteristics and the rainfall intensity you must design for, because the design storm duration is set equal to Tc.
This relationship creates a powerful feedback loop: smaller, steeper, smoother drainage areas have shorter times of concentration, which correspond to higher rainfall intensities on the IDF curve, which produce higher peak flow rates per unit area. This is why a small, heavily paved commercial lot can generate more runoff per acre than a large, gently sloping pasture.
Estimating Time of Concentration
Several methods exist for estimating Tc. For residential lots, two common approaches are:
Sheet flow (Kinematic Wave or Manning's equation): For the initial portion of flow where water moves as a thin sheet across the ground surface. Sheet flow is typically limited to distances of 100–300 feet. The NRCS sheet flow equation is:
Tc (minutes) = [0.007 × (n × L)^0.8] / [(P₂)^0.5 × S^0.4]
Where n is Manning's roughness coefficient, L is flow length in feet, P₂ is the 2-year, 24-hour rainfall depth in inches, and S is the slope (ft/ft).
Shallow concentrated flow and channel flow: For flow that has concentrated into rills, swales, or pipes, velocity-based methods are used. Flow velocity is estimated from slope and surface type, and travel time is calculated as distance divided by velocity.
For a typical suburban residential lot — say 100 feet of sheet flow across a lawn at 2% slope followed by 50 feet of shallow concentrated flow in a swale — the total time of concentration might be 12–18 minutes. This short Tc means you're reading the IDF curve at the steep, high-intensity end, which is why residential drainage design must account for intense, short-duration rainfall.
Common Mistakes with Time of Concentration
One of the most frequent errors in residential drainage design is using an incorrect time of concentration. Overestimating Tc leads to a lower design intensity and an undersized system. Common mistakes include:
- Using a Tc that's too long because sheet flow lengths exceed the 300-foot maximum (flow concentrates much sooner on developed land)
- Failing to account for impervious surfaces that dramatically increase flow velocities
- Using a minimum Tc that's too low (most jurisdictions specify a minimum Tc of 5–10 minutes to avoid unrealistically high intensities)
- Not recalculating Tc after site modifications that change slopes, flow paths, or surface types
Regional Variations in Rainfall Intensity
Rainfall intensity varies enormously across the United States, and understanding your region's precipitation characteristics is essential for appropriate drainage design. The design rainfall intensity for the same return period and duration can differ by a factor of three or more between different parts of the country.
High-Intensity Regions
The Gulf Coast and Southeast experience the highest short-duration rainfall intensities in the continental United States. Tropical moisture, convective thunderstorms, and tropical cyclones combine to produce extreme precipitation events. The 10-year, 15-minute intensity in Houston, Texas is approximately 6.5 inches per hour — meaning drainage systems must handle enormous flow rates. Coastal Louisiana, South Florida, and the central Gulf states experience similarly intense precipitation.
Moderate-Intensity Regions
The Mid-Atlantic, Midwest, and Southern Plains experience moderate to high rainfall intensities, driven primarily by convective thunderstorms in summer and frontal systems in other seasons. The 10-year, 15-minute intensity in cities like St. Louis, Nashville, or Philadelphia typically ranges from 4.5 to 5.5 inches per hour. These regions also experience significant variability — a single severe thunderstorm can produce localized rainfall far exceeding design values.
Low-Intensity Regions
The Pacific Northwest and Northern Rockies generally experience lower rainfall intensities, with precipitation dominated by long-duration, low-intensity frontal systems. The 10-year, 15-minute intensity in Seattle is only about 1.8 inches per hour — roughly one-third of Gulf Coast values. However, these regions can receive substantial total precipitation volumes over extended periods, making long-duration drainage capacity and soil saturation important considerations.
The arid Southwest presents a unique challenge: very low average precipitation but occasional intense convective storms (monsoons) that can produce localized intensities rivaling the Gulf Coast. Drainage systems in these regions must handle extreme intensity events despite the arid climate, and the lack of vegetation on desert soils means runoff coefficients can be surprisingly high.
Why Local Data Matters
These regional variations underscore why using site-specific precipitation data from NOAA Atlas 14 — rather than rules of thumb or data from a different region — is non-negotiable. A drainage system designed using Denver rainfall data will be catastrophically undersized if applied in Atlanta, and one designed for Seattle will be wildly over-engineered for the same site. Even within a single metropolitan area, Atlas 14 values can vary meaningfully due to orographic effects (mountain-induced rainfall enhancement) and urban heat island effects.
Putting It All Together: From Rainfall Data to Drainage Design
Understanding precipitation intensity is not an academic exercise — it's the starting point for every practical drainage decision on your property. Here's how the concepts connect to real-world drainage components:
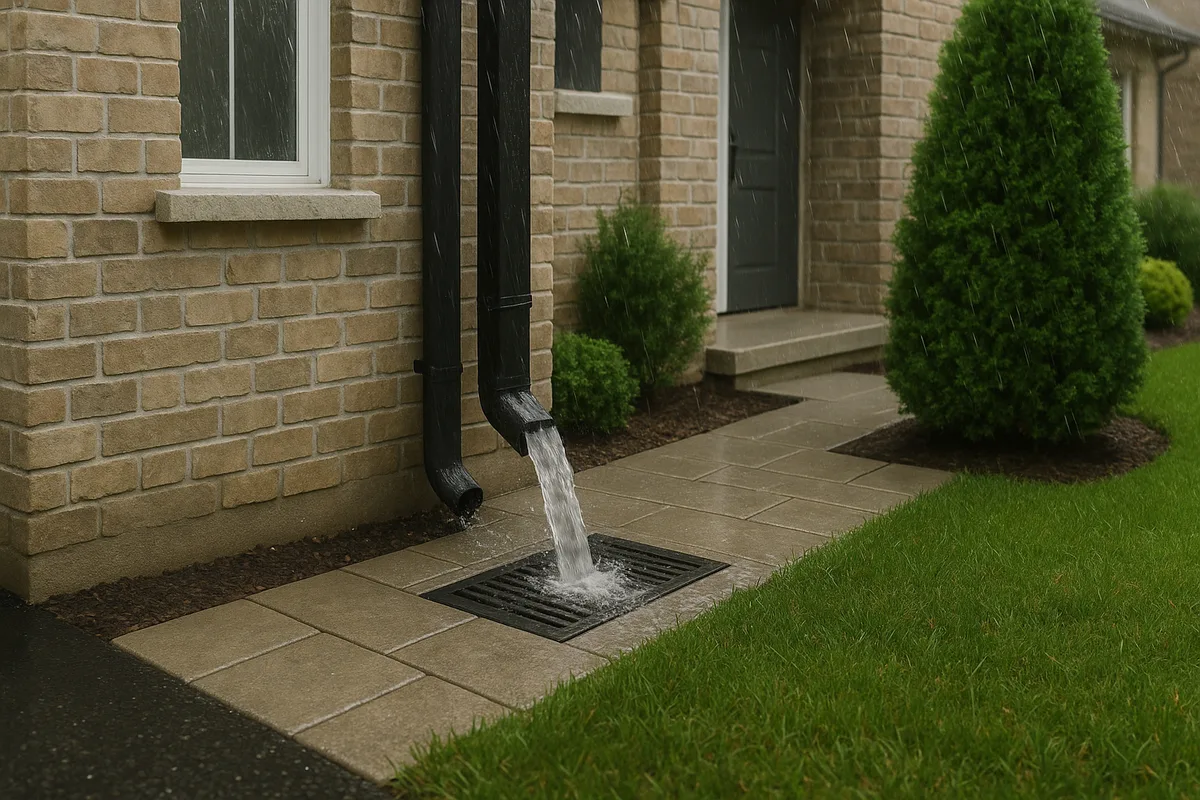
Gutter and Downspout Sizing
Roof gutters must convey the peak flow from your roof area during the design storm. For a 2,000-square-foot roof footprint (0.046 acres) with a runoff coefficient of 0.95 and a 10-year, 5-minute intensity of 6.0 in/hr:
Q = 0.95 × 6.0 × 0.046 = 0.26 cfs = approximately 117 gallons per minute
A standard 5-inch K-style gutter can handle roughly 6–8 gallons per minute per linear foot of gutter at typical slopes. If your home has 60 linear feet of gutter on one side draining to a single downspout, you need that downspout to handle the full accumulated flow. A single 2×3-inch downspout can handle approximately 600 square feet of roof area in moderate rainfall regions — meaning a 2,000-square-foot roof needs at minimum 3–4 downspouts, and more in high-intensity regions.
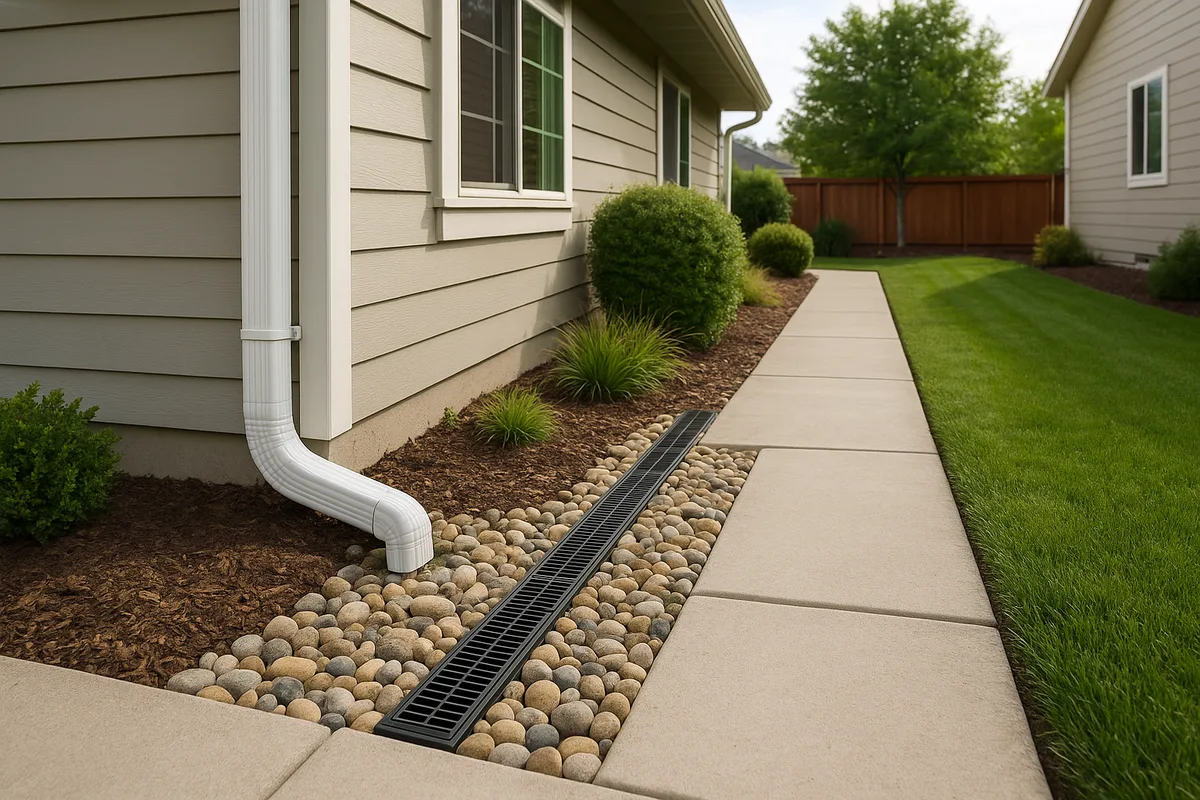
Yard Drainage and Swale Design
Yard swales and surface drainage channels are sized using Manning's equation, with the design flow rate derived from the Rational Method. A typical residential swale — 2 feet wide at the base, 1-foot deep, with 3:1 side slopes and a 1.5% longitudinal slope in a grass-lined channel — can convey approximately 1.5–2.0 cfs. Whether this is sufficient depends entirely on the contributing drainage area and the local rainfall intensity.
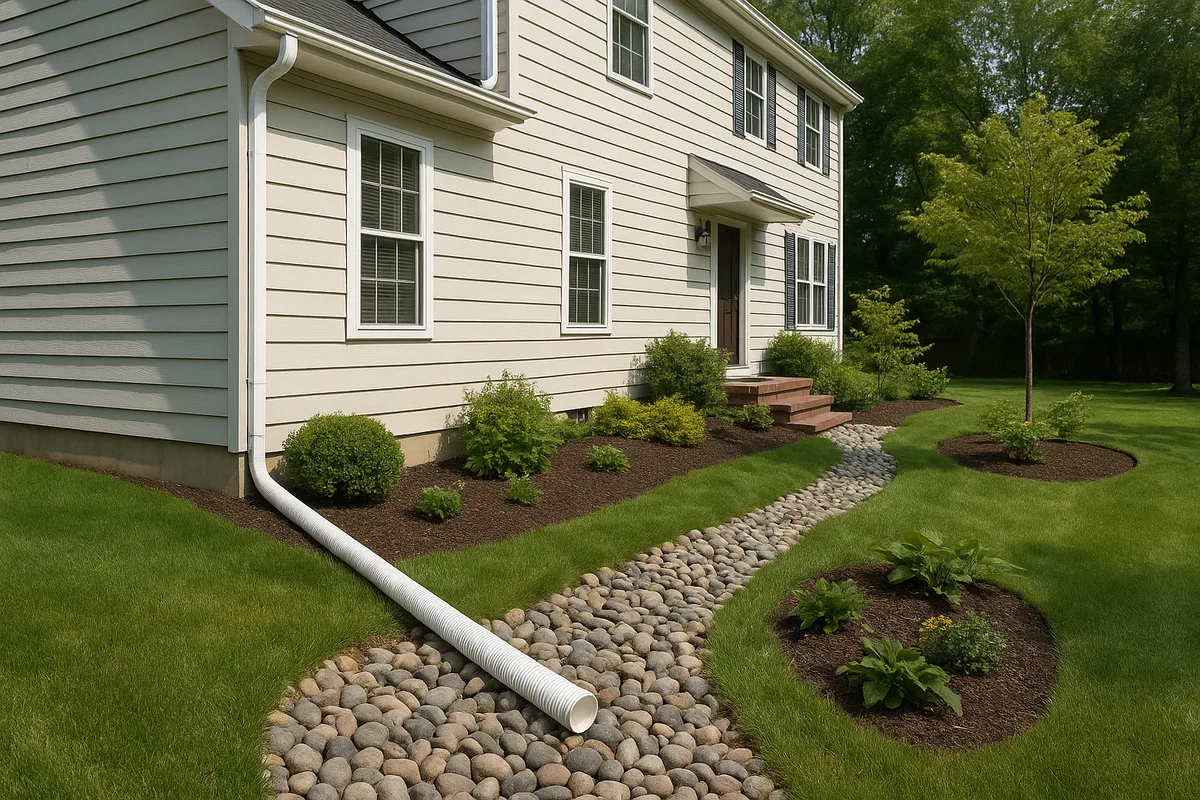
French Drain and Subsurface System Capacity
Subsurface drainage systems (French drains, curtain drains, perforated pipe systems) must handle both surface infiltration and, in some cases, groundwater interception. The perforated pipe at the core of a French drain is sized for the expected inflow, which is a function of rainfall intensity, soil infiltration rate, and contributing area. A 4-inch perforated pipe at 1% slope can convey approximately 0.15 cfs — sufficient for small residential applications but potentially inadequate for larger areas or high-intensity regions.
Foundation Grading and Overland Flow
The International Residential Code (IRC) requires a minimum 6-inch drop over the first 10 feet from the foundation — a 5% slope. This grading is designed to move water away from the foundation quickly enough that it doesn't pond or infiltrate near the footing. The adequacy of this grading under intense rainfall depends on the surface type (grass vs. mulch vs. bare soil), the upslope contributing area, and the local rainfall intensity. In high-intensity regions or on lots with significant upslope drainage areas, 5% may be insufficient, and supplemental drainage (swales, drains, or grading modifications) may be necessary.
Detention and Retention Sizing
For properties required to manage post-development runoff (increasingly common in suburban jurisdictions), the design storm's total depth and temporal distribution — not just peak intensity — drive the sizing of detention or retention facilities. A rain garden designed to capture the first inch of rainfall from a 500-square-foot patio must hold at least 42 cubic feet (500 × 1/12) of water, plus additional volume to account for soil saturation and reduced infiltration rates during the storm. The design storm return period determines how often the facility will overflow, and the temporal distribution affects the peak inflow rate and required outlet capacity.
Climate Change and the Future of Drainage Design
The relationship between precipitation intensity and drainage design is not static. Observed trends in rainfall data across much of the United States show increases in the frequency and intensity of extreme precipitation events. The most recent National Climate Assessment documents that the amount of precipitation falling in the heaviest 1% of events has increased by 37% in the Northeast, 27% in the Midwest, and 27% in the Southeast since 1958.
For drainage design, this means that systems sized using historical data may not provide the intended level of protection over their full service life. A drainage system installed today with a 50-year expected lifespan will be operating in a precipitation regime that may be measurably different from the one reflected in current IDF curves.
Practical Steps for Climate-Resilient Drainage
Homeowners and designers can take several practical steps to account for changing precipitation patterns:
- Use the most current precipitation data available. Ensure your designer is using NOAA Atlas 14 rather than outdated publications like TP-40.
- Consider designing to a higher return period. If your jurisdiction requires a 10-year design storm, consider voluntarily sizing critical components for the 25-year storm. The incremental cost is often modest compared to the cost of failure.
- Apply a climate adjustment factor. Adding 10–20% to the design rainfall intensity provides a buffer against future increases. Some jurisdictions are beginning to codify these adjustments.
- Build in overflow capacity. Design your drainage system with a defined overflow path for storms that exceed the design event. Even if the primary system is overwhelmed, a planned overflow route prevents uncontrolled flooding of structures.
- Reduce runoff at the source. Permeable pavements, rain gardens, disconnected downspouts, and increased vegetative cover all reduce the volume and rate of runoff, providing resilience against increasing rainfall intensity without requiring larger pipes and channels.
Taking Action: Assessing Your Property's Drainage Capacity
Understanding precipitation intensity and its role in drainage design empowers you to ask the right questions about your property. Is your drainage system sized for the storms your region actually experiences? Was it designed using current NOAA rainfall data, or is it based on outdated estimates? Has your property's impervious area increased since the drainage was originally designed? Are there signs — ponding, erosion, foundation moisture — that suggest your system is being overwhelmed during storms that shouldn't exceed its capacity?
At Low Point Labs, we specialize in topographic drainage intelligence that connects the dots between your property's terrain, your local precipitation data, and the performance of your drainage infrastructure. Our assessments use high-resolution elevation data and current rainfall intensity analysis to identify vulnerabilities before they become costly problems. If you're concerned about how your property handles intense rainfall — or if you're planning improvements and want to get the drainage right from the start — explore our drainage assessment services to get the data-driven insights you need to protect your home.
Get Your Drainage Intelligence Report™
Start a free trial and generate reports on demand.
Frequently Asked Questions
Related Articles
Runoff Calculations Using the Rational Method: A Complete Guide
How to Calculate Runoff for Residential Drainage Projects